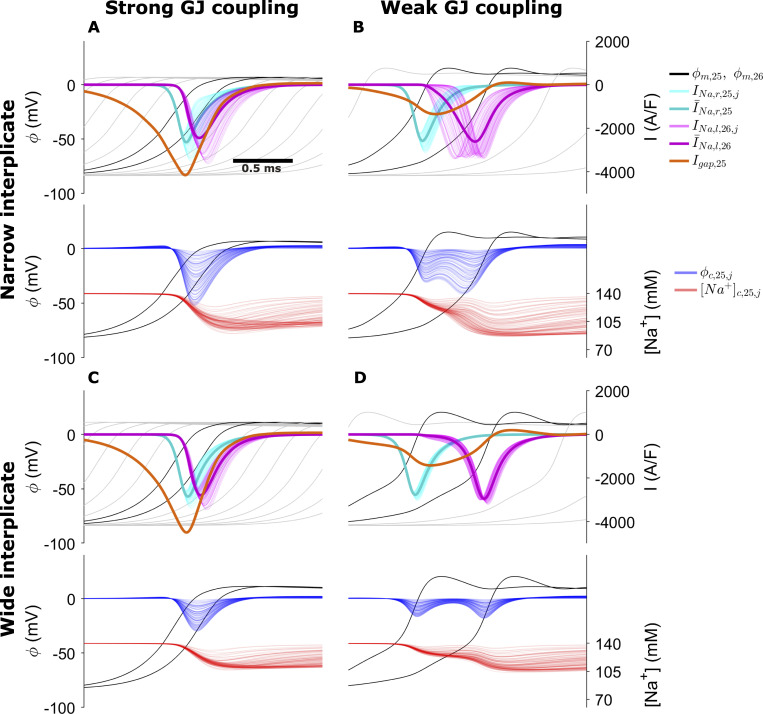
Figure 8.
Membrane and cleft dynamics during electrical conduction in the cleft network model for the following cases.(A) High GJ coupling, narrow interplicate. (B) Weak GJ coupling, narrow interplicate. (C) Strong GJ coupling, wide interplicate. (D) Weak GJ coupling, wide interplicate. Top in each panel: Transmembrane potential ϕm (black, for cells 25 and 26; gray for upstream and downstream cells), cell 25 prejunctional (right, INa, cyan) and cell 26 postjunctional (left, INa, magenta) Na+ current, GJ current (orange). Bottom in each panel: Cleft potential ϕc, and cleft [Na+] for all cleft compartments are shown as a function of time. Dark cyan and magenta curves represent the mean pre- and postjunctional INa, respectively. Parameters: M = 100; plicate distance dP = 30 nm; gap junctional conductance ggap (nS): A and C, 388; B and D, 38.8; interplicate distance dIp (nm): A and B, 15; C and D, 60.

