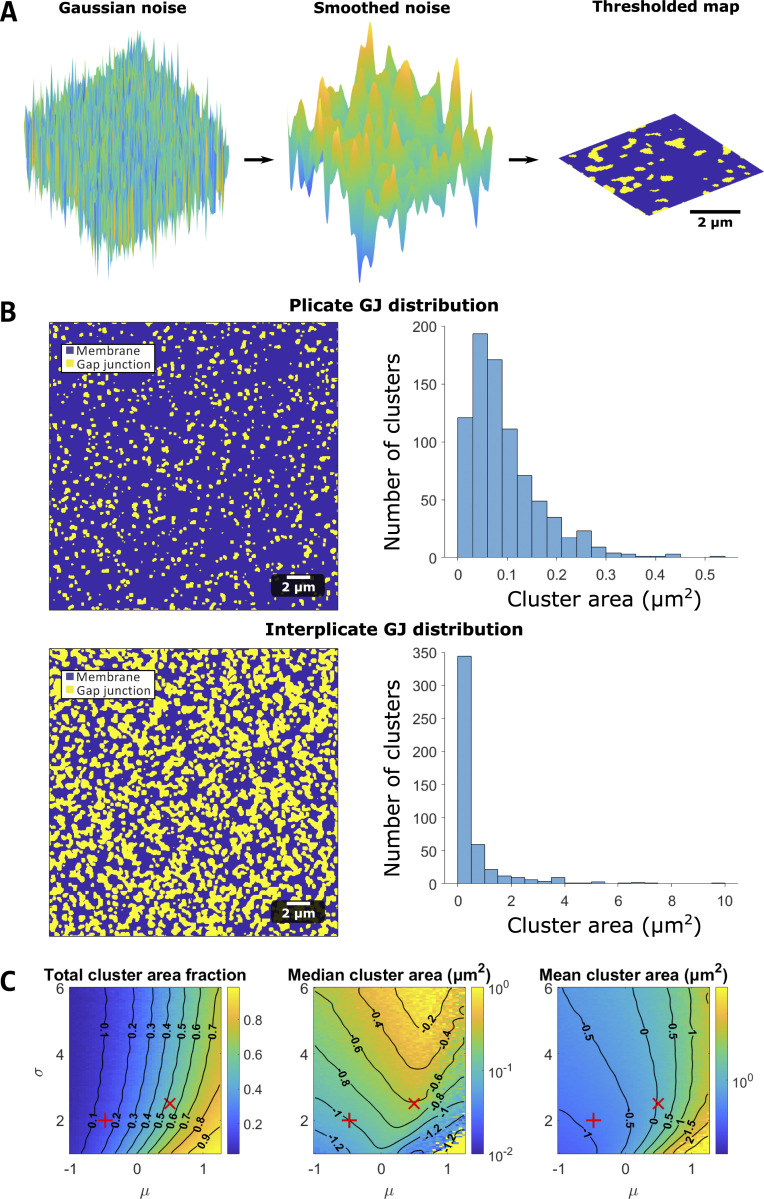
Figure S2.
Map generation algorithm and GJ distribution calculations.(A) Maps are generated by drawing a 2-D array of Gaussian random noise (left). The noise is then smoothed (center) and thresholded (right) to generate a map (for either the ID or GJ distribution). (B) Plicate and interplicate GJ distributions. Left: GJ cluster examples, illustrating GJs (yellow) and membrane (blue). Right: Cluster size distributions for the plicate and interplicate regions. (C) Parameter study for GJ map algorithm parameters (μ and σ, see supplemental text at the bottom of the PDF for details), illustrating the parameter dependence of cluster membrane area fractions, median cluster area, and mean cluster area. The red + and X denote the plicate and interplicate distribution parameters, respectively.

