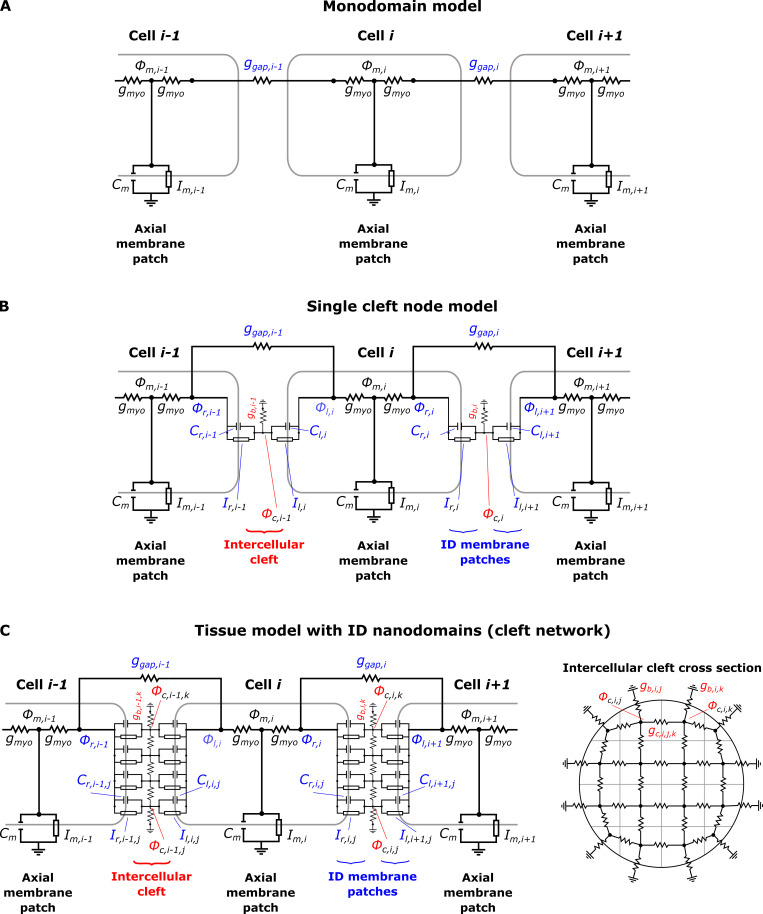
Figure S6.
Schematic of the electrical circuits for the tissue models compared in the study.(A) Standard monodomain model; the cells are directly connected through the GJ resistor ggap. (B) Single-cleft model: In addition to GJ coupling, a single intercellular cleft node mediated ephaptic coupling between adjacent cells at the ID. (C) The extracellular/intercellular cleft space is modeled as a network of nodes, coupled via electrical resistors with conductance values derived from a FEM mesh (Fig. 3).

