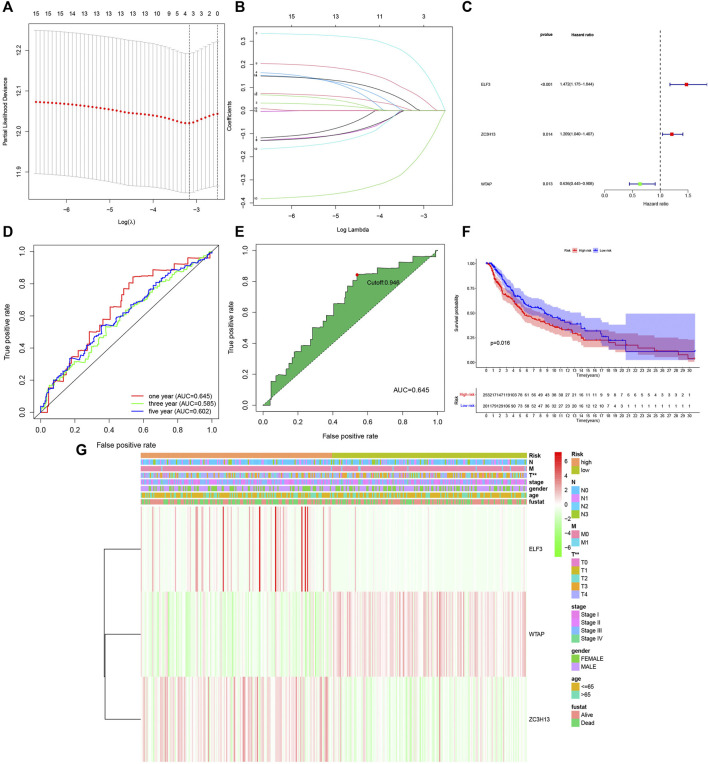
FIGURE 4.
Construction of the three m6A RNA methylation regulators-based risk signature. (A–B) Determination of the number of factors by the LASSO analysis. (C) Multivariate analysis of the three-gene signature (ELF3,ZC3H13, AND WTAP). (D) Receiver operating characteristic (ROC) curves for 1-,3-,5-year prognosis. (E) 1 year was chosen to calculate the best cutoff value. (F) The kaplan-Meier curves of melanoma patients at the high-risk group and low-risk group in TCGA cohort. (G) The expression features of the three m6A RNA methylation regulators and the disteibution of clinicopathological features were compared between the low-and high group of The Cancer Genome Atlas (TCGA) melanoma datasets. p < 0.01 (“**”).

