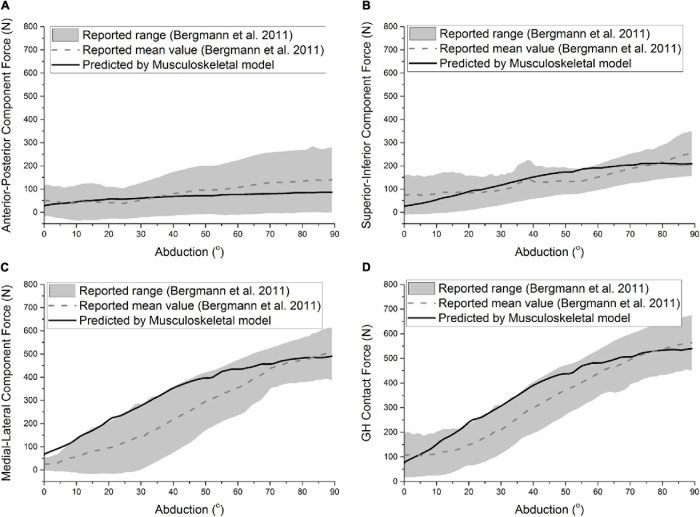
FIGURE 2.
Predicted anterior-posterior component force (A), superior-inferior component force (B), medial-lateral component force (C), and GH contact force (D) of ATSA was compared with the results of Bergmann et al. (2011) during the abduction. The gray area and the dashed line represent the range and mean value formed by the measured GH forces of six patients.

