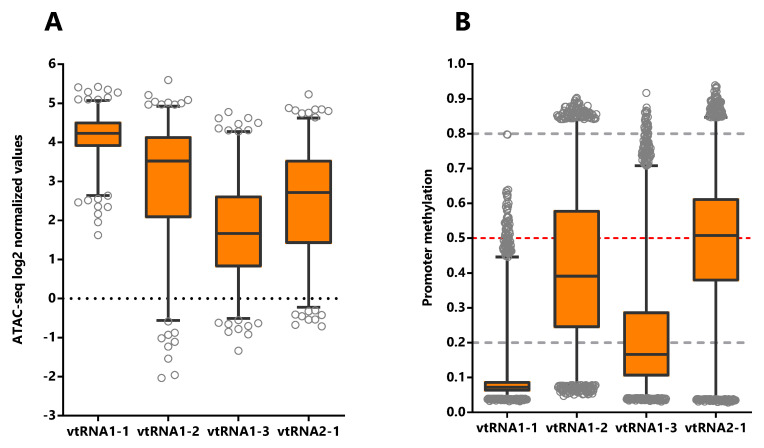
Figure 2. Chromatin accessibility and DNA methylation of the vtRNA promoters.
Analysis of vtRNA 500bp promoter region. A. Average chromatin accessibility ATAC-seq values for the 385 primary tumors available at the Pan-Cancer TCGA dataset (23 tissues types). B. Average DNA methylation beta-values for the 8403 primary tumors (32 tissues types). Dashed horizontal lines denote unmethylated (bottom gray, average beta-value ≤ 0.2), 50% methylated (middle red, average beta-value = 0.5) and highly methylated (top gray, average beta-value ≥ 0.8) promoters. The box plots show the median and the lower and upper quartile, and the whiskers the 2.5 and 97.5 percentile of the distribution.

