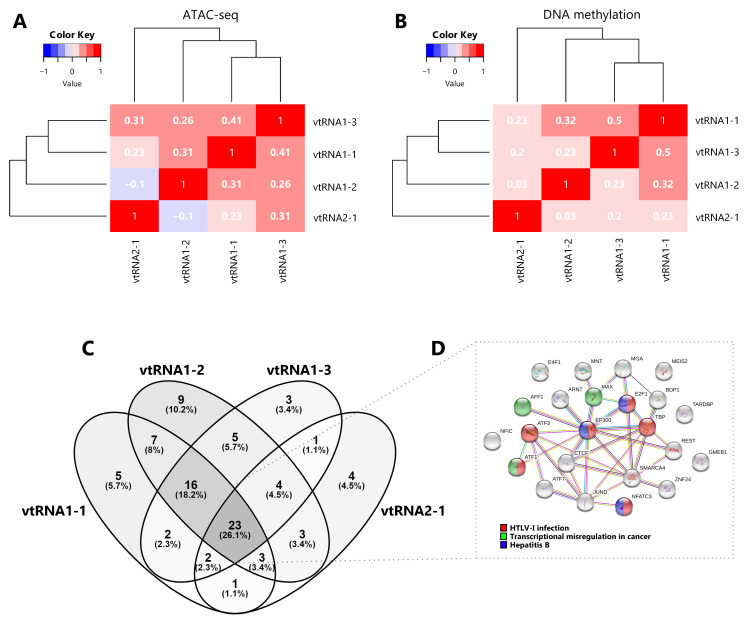
Figure 3. Comparative chromatin accessibility and transcription factor occupancy at the vtRNA loci.
A–B Matrix of pairwise Spearman correlations (two-way hierarchical clustering distance measured by Euclidean and Ward clustering algorithms) of vtRNA 500 bp promoter region for ATAC-seq data (385 primary tumors samples across 23 tissues) ( A) and DNA methylation average beta-values data (8403 primary tumors samples across 32 tissues) ( B). C. Venn diagram of transcription factors identified as ChIP-seq Peaks by ENCODE 3 project in the cell line K562 (Venny 2.1; https://bioinfogp.cnb.csic.es/tools/venny/index.html). The region for TFs assignment was defined as ±3000 bp from the vtRNA transcript sequence boundaries. D. Interaction cluster of the core 23 TFs common to all vtRNAs performed with STRING ( Szklarczyk et al., 2017). The colored labels of the top 3 enriched KEGG pathway terms (FDR < 0.05) are indicated.

