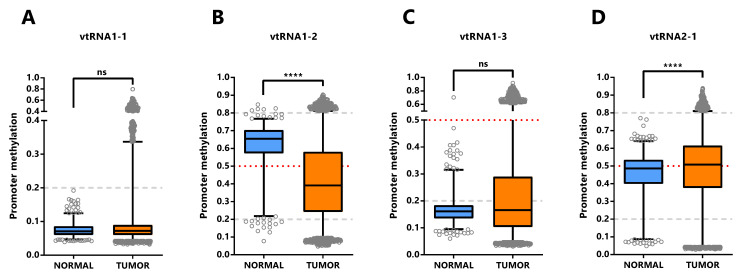
Figure 5. Promoter DNA methylation of vtRNAs in Normal and Tumor tissues of Pan-Cancer TCGA dataset.
Average beta-values of promoter DNA methylation of vtRNA1-1 ( A), vtRNA1-2 ( B), vtRNA1-3 ( C) and vtRNA2-1 ( D), assessed in 746 normal and 8403 tumor tissues respectively. The box plots show the median line and lower and upper quartile and the whiskers the 2.5 and 97.5 percentile. Horizontal grey striped and red dotted lines denote unmethylated (average beta-value ≤ 0.2), 50% methylated (average beta-value = 0.5) and highly methylated (average beta-value ≥ 0.8) promoters. One-way ANOVA multiple test analysis with Sidak as posthoc test was performed. **** p-value < 0.0001.

