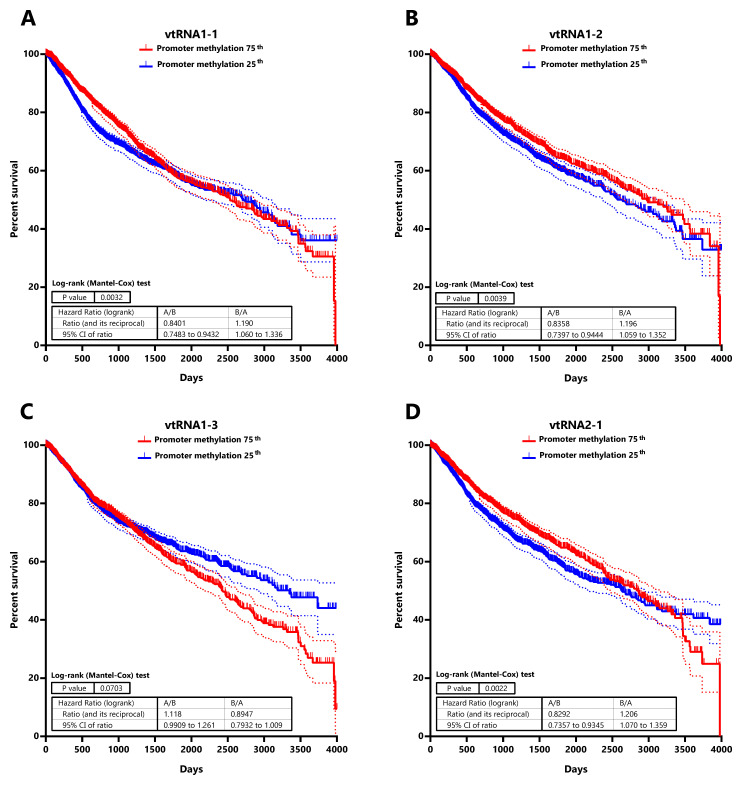
Figure 7. Association between patient Overall survival and vtRNA promoters DNA methylation status in Pan-Cancer TCGA dataset.
Kaplan-Meier curves of overall patient survival probability over the time (4000 days) discriminating the primary tumors into two cohorts with relatively higher (75 th) and lower (25 th) DNA methylation at each vtRNA promoter. Promoter DNA methylation data of the 8060 primary tumors was used to stratify the patients in two quartiles, based on the expression of vtRNA1-1 ( A) vtRNA1-2 ( B), vtRNA1-3 ( C) and vtRNA2-1 ( D). Patient survival probability of the two groups was analyzed using Log-rank (Mantel-Cox) test. The dotted lines represent the 95% confidence interval for each curve.

