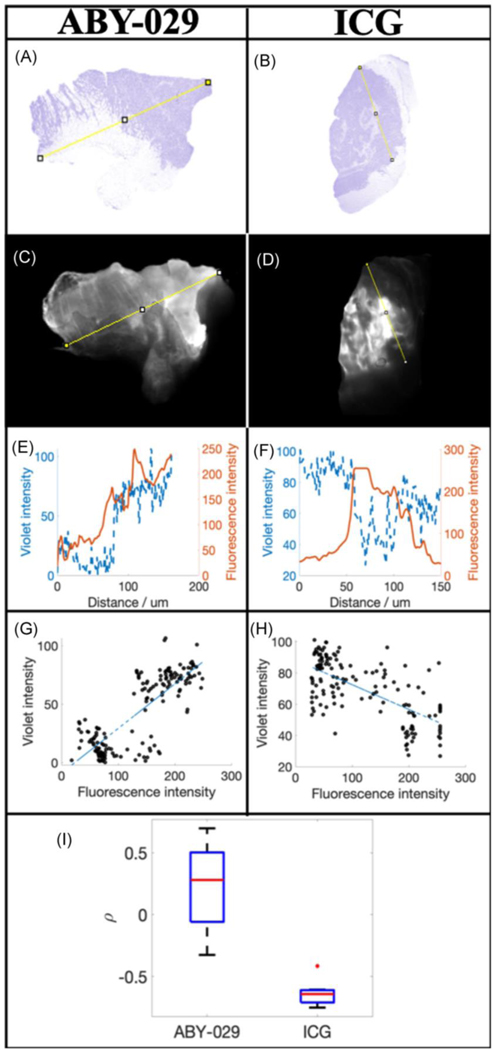
Figure 2.
Comparison of the distributions of ABY-029 and ICG in xenograft soft-tissue sarcomas. H&E (a and b) and corresponding fluorescence (c and d) images of ABY-029 and ICG, respectively. The pixel value of the violet stain and fluorescence intensity was determined along the yellow lines were plotted in (e) and (f) for ABY-029 and ICG, respectively. The Spearman’s correlation coefficient between violet intensity and ABY-029 or ICG fluorescence intensity was determined from scatter plots (g and h, respectively) and the resultant coefficients plotted in (i).

