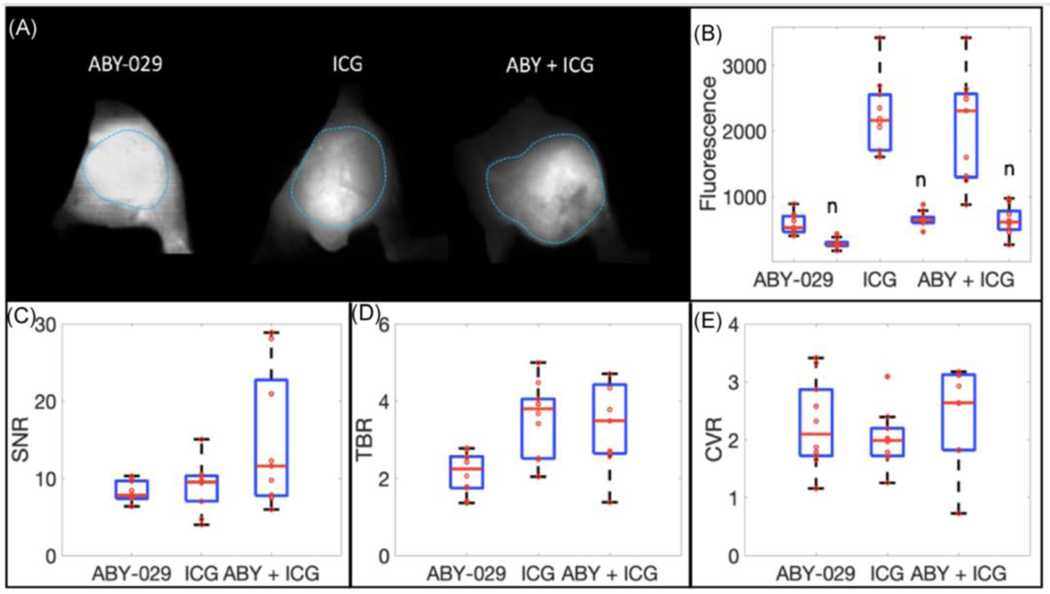
Figure 4.
In vivo fluorescence imaging of soft-tissue sarcomas. (a) Representative examples of ABY-029, ICG and ABY-029 + ICG images in murine xenograft intra-muscular tumor. (b) Average fluorescence intensities of each mouse in tumor and normal (n) tissues for each fluorophore type. Image contrast was calculated in three ways: (c) signal-to-noise ratio (SNR), (d) tumor-to-background ratio (TBR), and (e) contrast-to-variance ratio (CVR).

