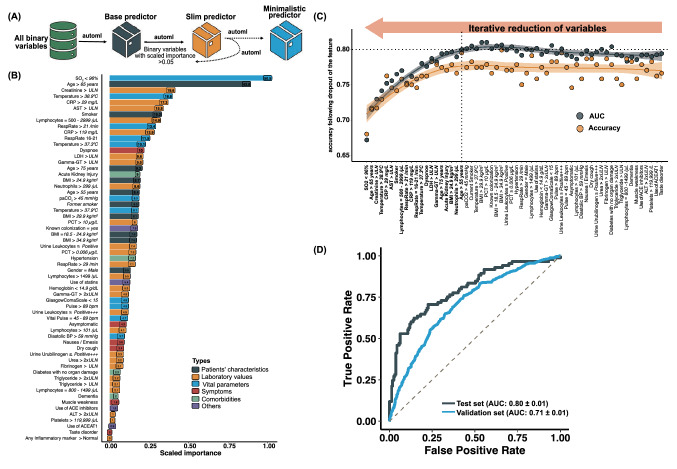
Fig. 1.
Machine-learning scheme and results. A Schematic workflow illustrating the iterative reduction of variables. First, the best performing predictor was selected based on all baseline variables (“base predictor”). Next, variables were removed following an iterative optimization procedure leading to the slim predictor and the minimalistic predictor. B Ranking of the variables for the “slim predictor” by their scaled importance. Values in parentheses depict the relative importance. C Performance (area under the curve [AUC] and accuracy) of predictors during the iterative optimization in a top down procedure. From right to left, the procedure started with n = 61 variables removing one variable at a time (displayed on the x-axis). The performance declined considerably at n = 21 variables which led to the selection of the minimalistic predictor just before this decline. D Receiver operating characteristics (ROC) curve of the minimalistic predictor on the test and validation set

