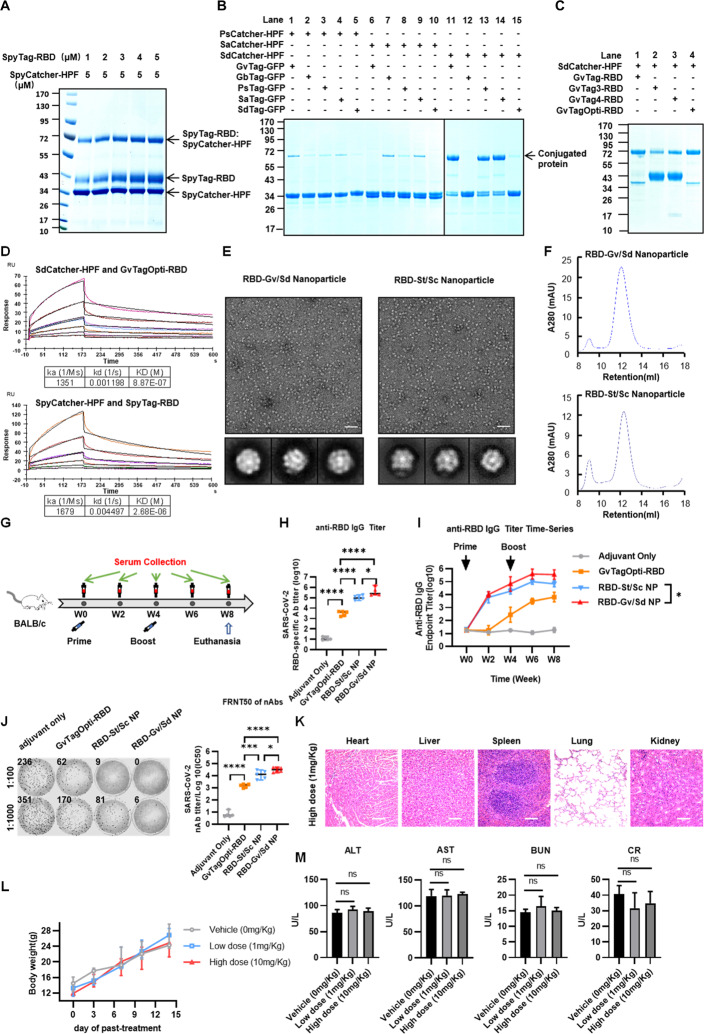
Fig. 1.
Development of a Gv/Sd linker system for assembling nanoparticles with high efficiency to improve the SARS-CoV-2 vaccine. A The assembly efficiency of the previous St/Sc construct was analyzed by coincubating SpyTag-RBD with SpyCatcher-HPF, followed by SDS-PAGE analysis with Coomassie staining. B The binding efficiency was evaluated by coincubating the various combinations of Tag-GFP and Catcher-HPF, followed by SDS-PAGE analysis with Coomassie staining. C The covalent conjugation ability was assessed by coincubating SdCatcher-HPF with various GvTag-RBDs, followed by heating at 95 °C for 10 min in loading buffer and subsequent SDS-PAGE analysis with Coomassie staining. D Surface plasmon resonance (SPR) was used to analyze the affinity between Tag-RBDs and Catcher-HPFs. E TEM images and two-dimensional (2D) reconstruction of each nanoparticle. Scale bars represented 100 nm. F SEC of RBD-Gv/Sd and RBD-St/Sc nanoparticles. The ultraviolet absorptions at 280 are shown. The retention volume represents the peak of each nanoparticle. G Schematic of BALB/c mouse vaccination. Five mice from each group were prime/boost vaccinated with NP vaccines at weeks 0 and 4. Serum was collected every two weeks. All mice were euthanized at week 8. H SARS-CoV-2 RBD-specific IgG titers of immunized BALB/c mice at week 6 were detected by ELISA. IgG antibody titers in serum were determined by serial dilution and are represented as the reciprocal of the endpoint serum dilution [3]. I RBD-specific IgG titers at each collection point were calculated and plotted as a time-course curve. J The FRNT50 of nAbs of each vaccine group was determined by FRNT and is represented as the half-maximal inhibitory concentration (IC50) against authentic virus, which is the reciprocal of the half-maximal neutralizing dilution (n = 5). The left panel shows representative FRNT spot wells within the 1:100 and 1:1000 dilution groups. Data represent the mean ± SEM (n = 5). Adjusted p values were calculated by one-way ANOVA with Tukey’s multiple comparisons test. *p ≤ 0.05, **p ≤ 0.01, ***p ≤ 0.001, ****p ≤ 0.0001. K HE staining was evaluated in the major organs of high-dose mice. L The body weight of each mouse was measured every 3 days, and the mice were treated subcutaneously with various doses of GvTagOpti-SdCatcher protein. Data represent the mean ± SEM (n = 5). M A series of liver and renal function tests was performed 2 weeks after the GvTagOpti-SdCatcher protein treatments, including measurement of ALT (alanine aminotransferase), AST (aspartate aminotransferase), BUN (blood urea nitrogen), and CRE (creatine) levels

