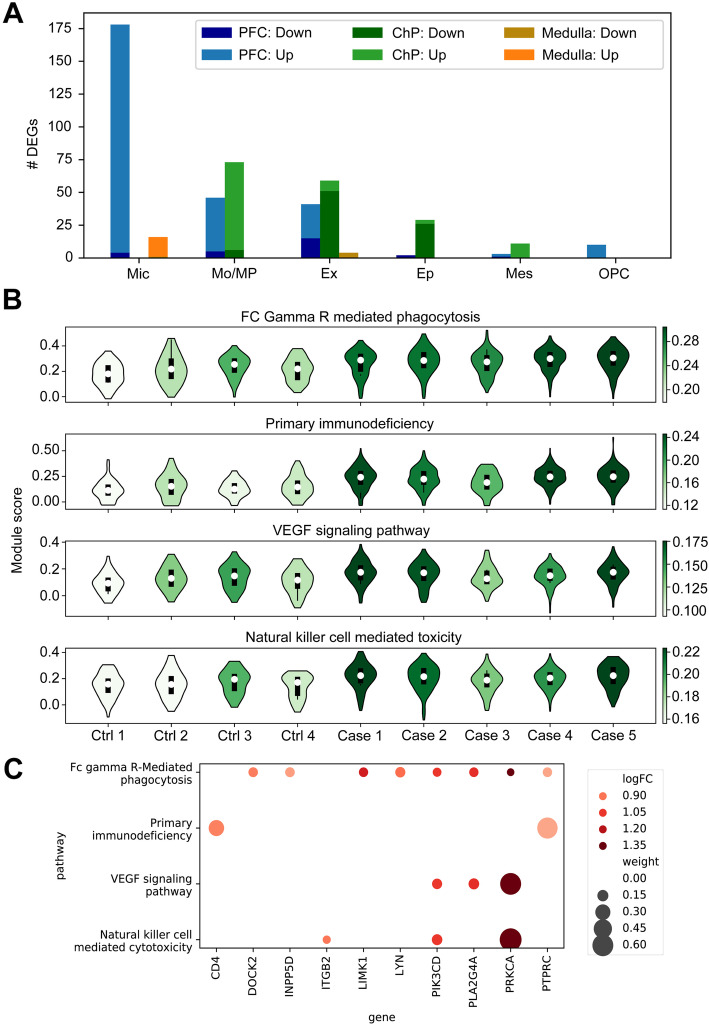
Fig. 2.
Differential gene expression and gene set enrichment analyses in COVID-19 patients compared to controls. A Number of differentially expressed genes (DEGs) identified in cell types across three brain regions. Up- and downregulated genes are shown in different colors. Cell types are ranked by the total number of DEGs across three brain regions. Cell types with no more than 10 DEGs in any brain region are omitted. B Gene set activity scores of PFC microglia. The four most significant pathways among 186 KEGG gene sets are shown. The shade of a violin indicates the median activity score of each individual. C Ten differentially expressed genes (FDR < 0.05) in four upregulated pathways are shown. The size of a circle shows the relative weight of a gene that contributed to the activity of a pathway. The relative weight is estimated as the ratio of the expression level of a gene to the sum of expression of all genes in the pathway. Colors show the log fold change

