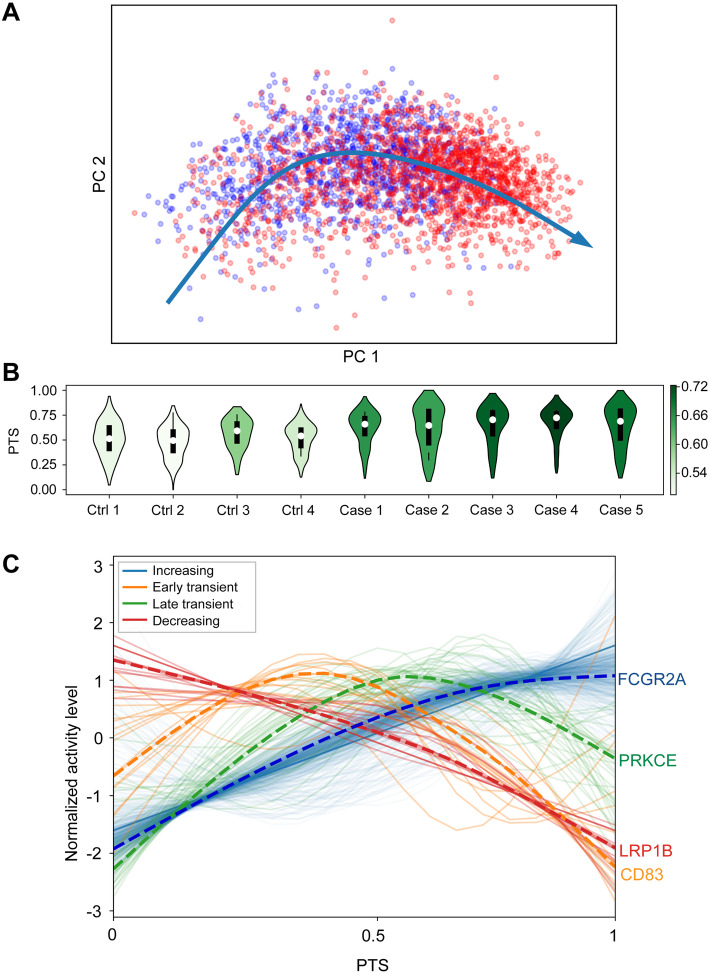
Fig. 3.
Pseudo-temporal trajectory score (PTS) analysis in the microglia-identified gene expression signatures with differential progression patterns in COVID-19 cases. A Pseudo-temporal trajectory in the microglia across three brain regions. Red and blue colors label cells from COVID-19 cases and controls, respectively. B PTS across 5 COVID-19 patients and 4 controls in PFC microglia. The shade of violin plots indicates the median activity score of each individual. C We identified 4 types of gene expression progression patterns over the pseudo-temporal trajectory: increasing (blue), early transient (orange), late transient (green), and decreasing (red). A dashed line shows the profile of a representative gene in each group

