Figure 1.
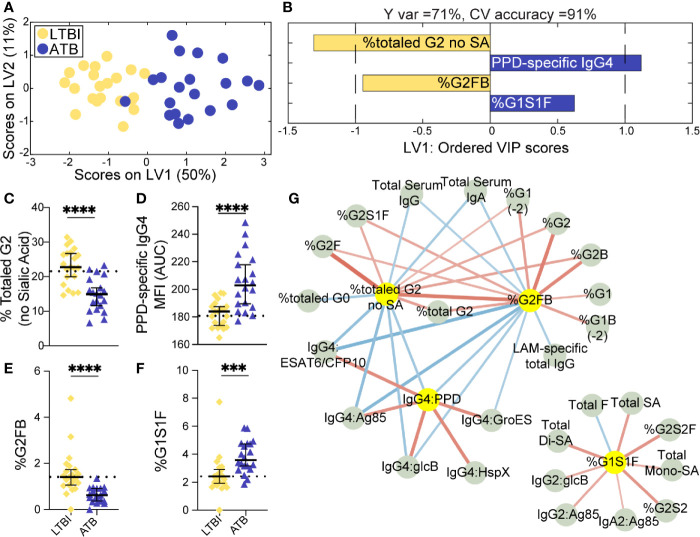
Fc-glycosylation and TB-specific IgG subclass distinguish LTBI and ATB individuals. An orthogonalized PLSDA (OPLSDA) model was created based on four LASSO-identified antibody features that discriminate LTBI from ATB (A, B). Latent variable 1 (LV1) explains 71% of Y variance in the direction of LTBI and ATB separation. 5-fold cross validation (CV) was performed, resulting in 91% CV accuracy. The model significantly outperformed models based on shuffled group labels (permutation testing, Wilcoxon p=2E-5) (A) PLSDA scores plot depicts model separation of LTBI (n = 21, yellow dots) and ATB (n = 20, blue dots). LV1 and LV2 account for 50% and 11% of the variability of the input features. (B) Variable Importance in Projection (VIP) scores plot of top features providing the greatest resolution of LTBI and ATB in rank-order. Directions of the bars signify loadings on LV1 and colors represent the disease groups in which measures were enriched. Pairwise comparison of LTBI (n = 21, yellow diamonds) and ATB (n = 20, blue triangles) individuals (C) The frequencies of totaled G2 structures without sialic acid on IgG-Fc of LTBI and ATB individuals. (D) AUC of PPD-specific IgG4 titers. (E) percentage of G2FB glycan on IgG (F) percentage of G1S1F glycan on IgG. Univariate plots (C-F) show median and interquartile range of each LASSO-selected measure; statistically significant differences between LTBI and ATB groups calculated using Mann-Whitney test: ***p < 0.0005 and ****p < 0.0001. The dotted lines represent median of healthy controls individuals tested. (G) Correlation analysis depicts other features that are positively (red lines) or negatively (blue lines) correlated with these four key features selected with LASSO (highlighted in yellow). The color intensity and width of the edges between nodes are proportional to the significance of correlation coefficients after correcting for multiple comparisons (Benjamini-Hochberg q-value < 0.05, testing the hypothesis of zero correlation). Only correlations with corrected p-values < 0.05 were included.

