
Figure 1.
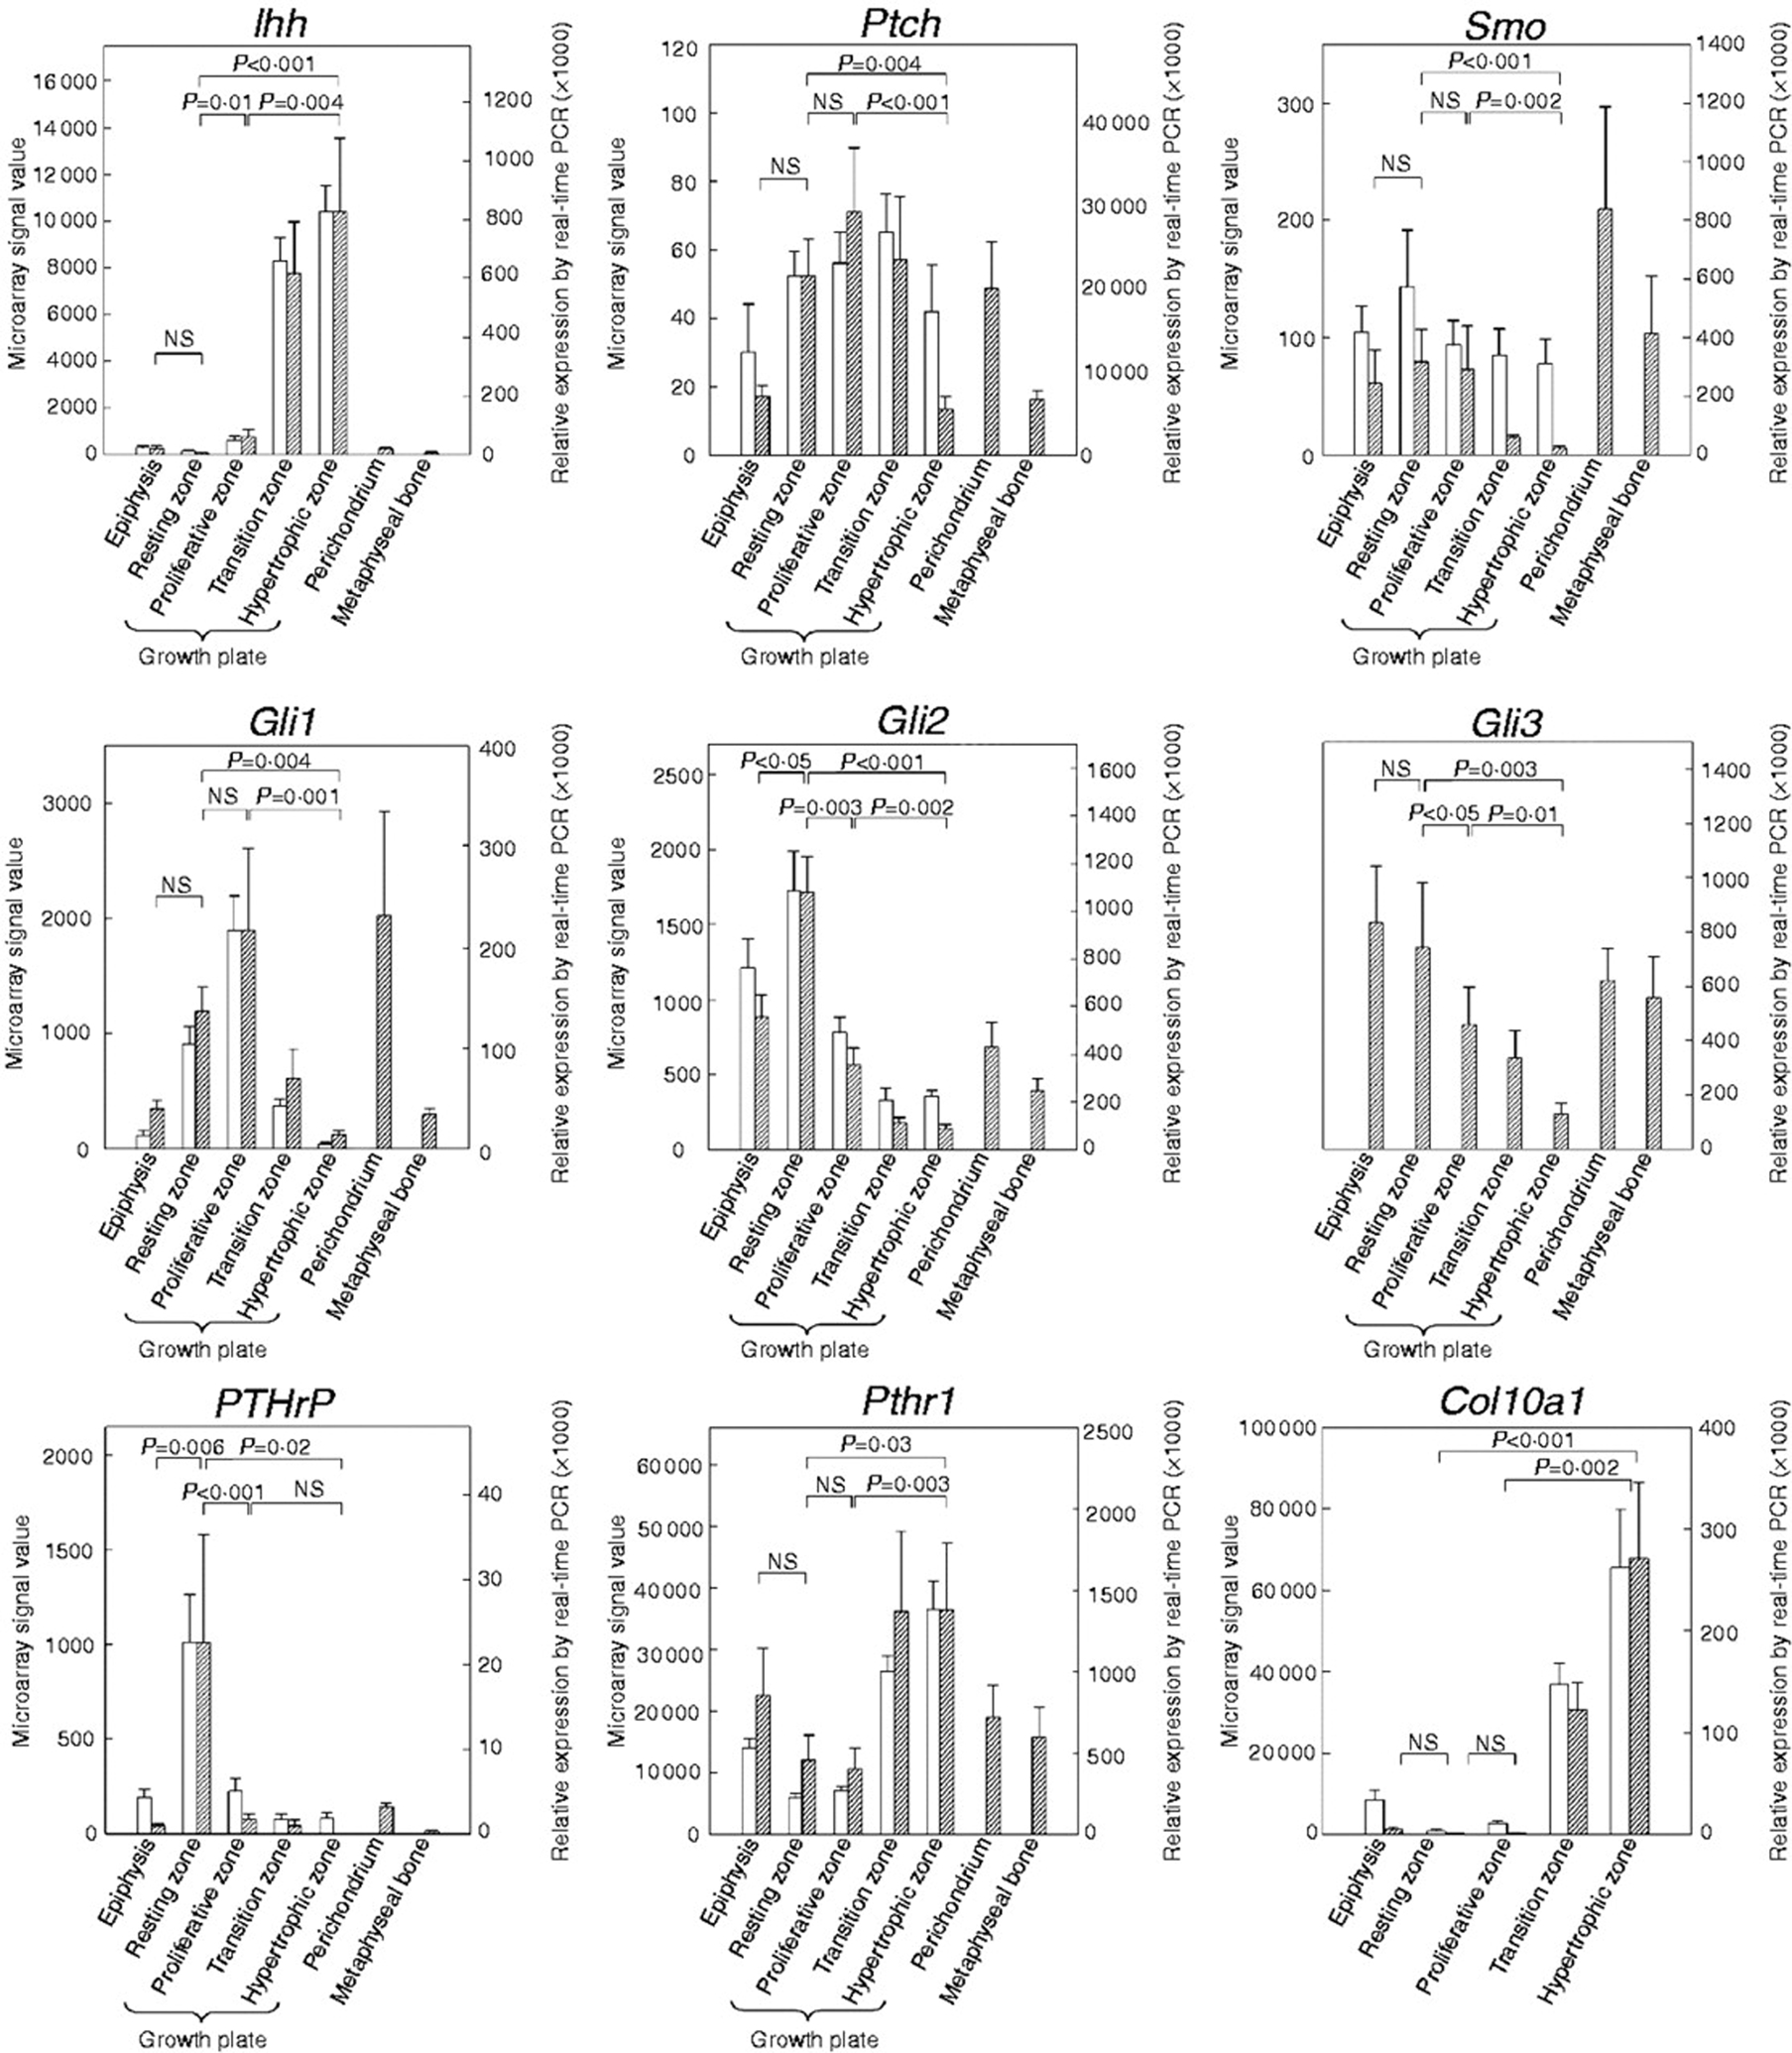
Expression of genes participating in the Ihh–PTHrP system in growth plate and surrounding tissues. Growth plate cartilage was microdissected into its constituent zones, and relative mRNA expression of Ihh, Ptch1, Smo, Gli1, Gli2, Gli3, PTHrP, Pthr1, and Col10a1 was determined using microarray analysis (n=4–5) and/or real-time RT-PCR (n=5–7). Microarray signal values (white bars, left y-axis) were background corrected and normalized. Relative expression values (hatched bars, right y-axis) generated by real-time RT-PCR were normalized to 18S rRNA. Values are mean±s.e.m. NS, not significant. The microarray did not include a probe set for Gli3.