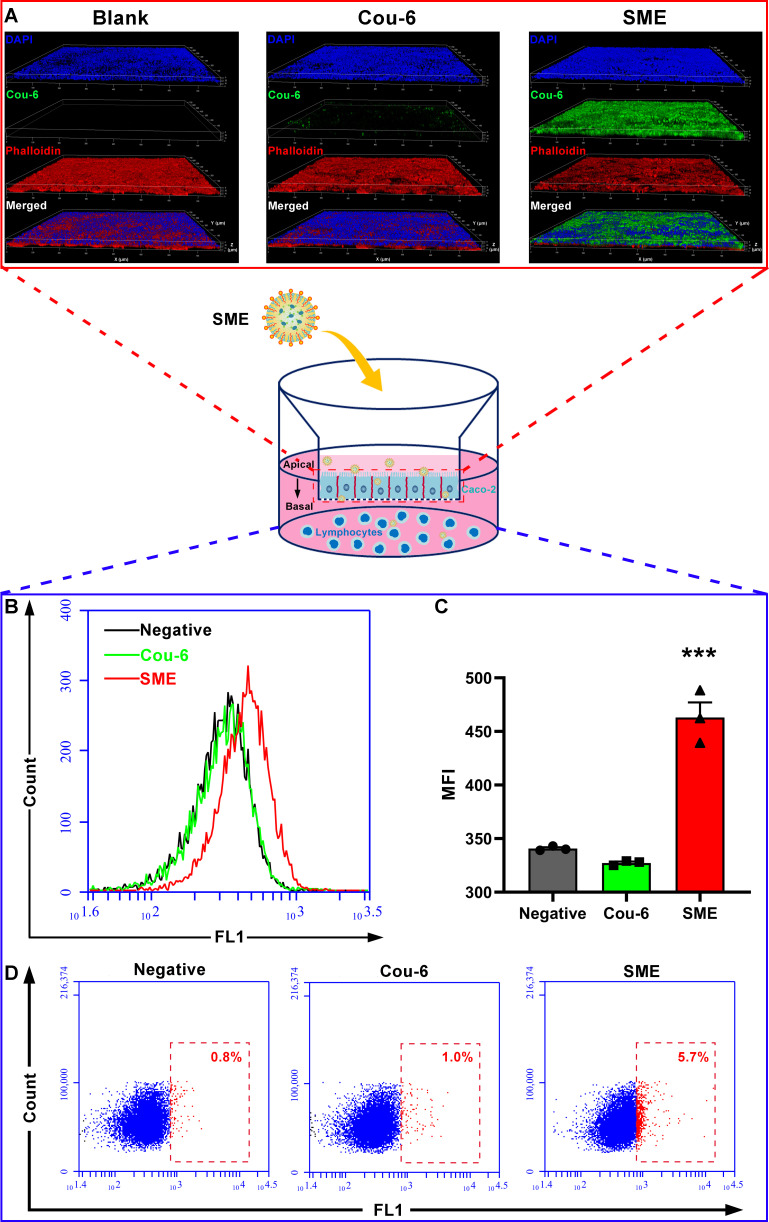
Figure 3.
Transport profile of CHA-SME within Caco-2 cell monolayers. (A) CLSM images of Caco-2 cell monolayer after incubation with Cou-6-labeled CHA-SME. the cell nuclei and cytoskeleton were stained with DAPI (blue) and phalloidin (red), respectively. (B, C) The in vitro cellular uptake profile of Cou-6-labeled CHA-SME in lymphocytes determined by flow cytometry. Each value represents the mean±SEM (n=3). ***P<0.001 compared with the Cou-6. (D) The percentage of Cou-6-positive lymphocytes determined by flow cytometry. CHA-SME, chlorogenic acid-encapsulated SMEDDS; CLSM, confocal laser scanning microscopy.

