
Figure 1.
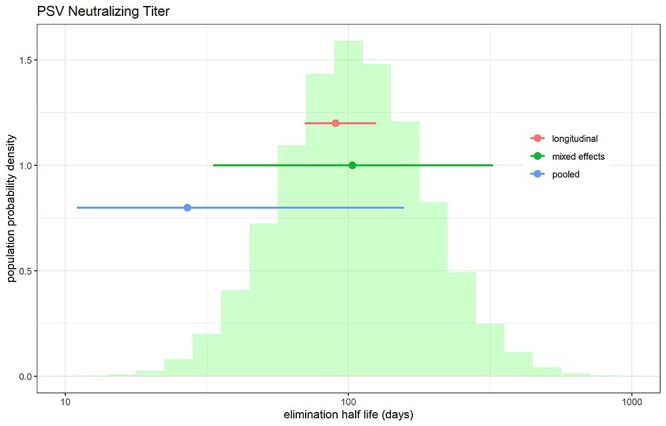
Distribution of half-life of pseudovirus neutralizing titer obtained from applying MEM for a single exponential model to the data from [1]. The histogram was generated by combining 1000 simulated MEM parameter realizations per patient in the original dataset. Mean and 95% CI from pooled (blue), “longitudinal” (red) analysis reported in [1] are shown as dot-and-whiskers plots. Green dot and whiskers indicate “population” median and 95% limits of estimated elimination half-lives from MEM (corresponding to the 2.5, 50 and 97.5% quantiles of the histogram).