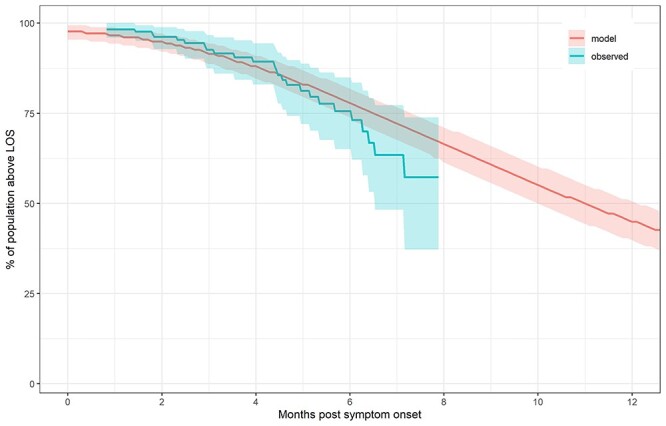
Figure 2.

Loss of sensitivity (LOS) of PSV across the patient population over time. Blue time-to-event curve represents observed fraction above LOS (with bootstrapped 95% CI). Red curve represents simulated fraction using nonlinear MEM (with bootstrapped 95%CI).
