
Figure 4.
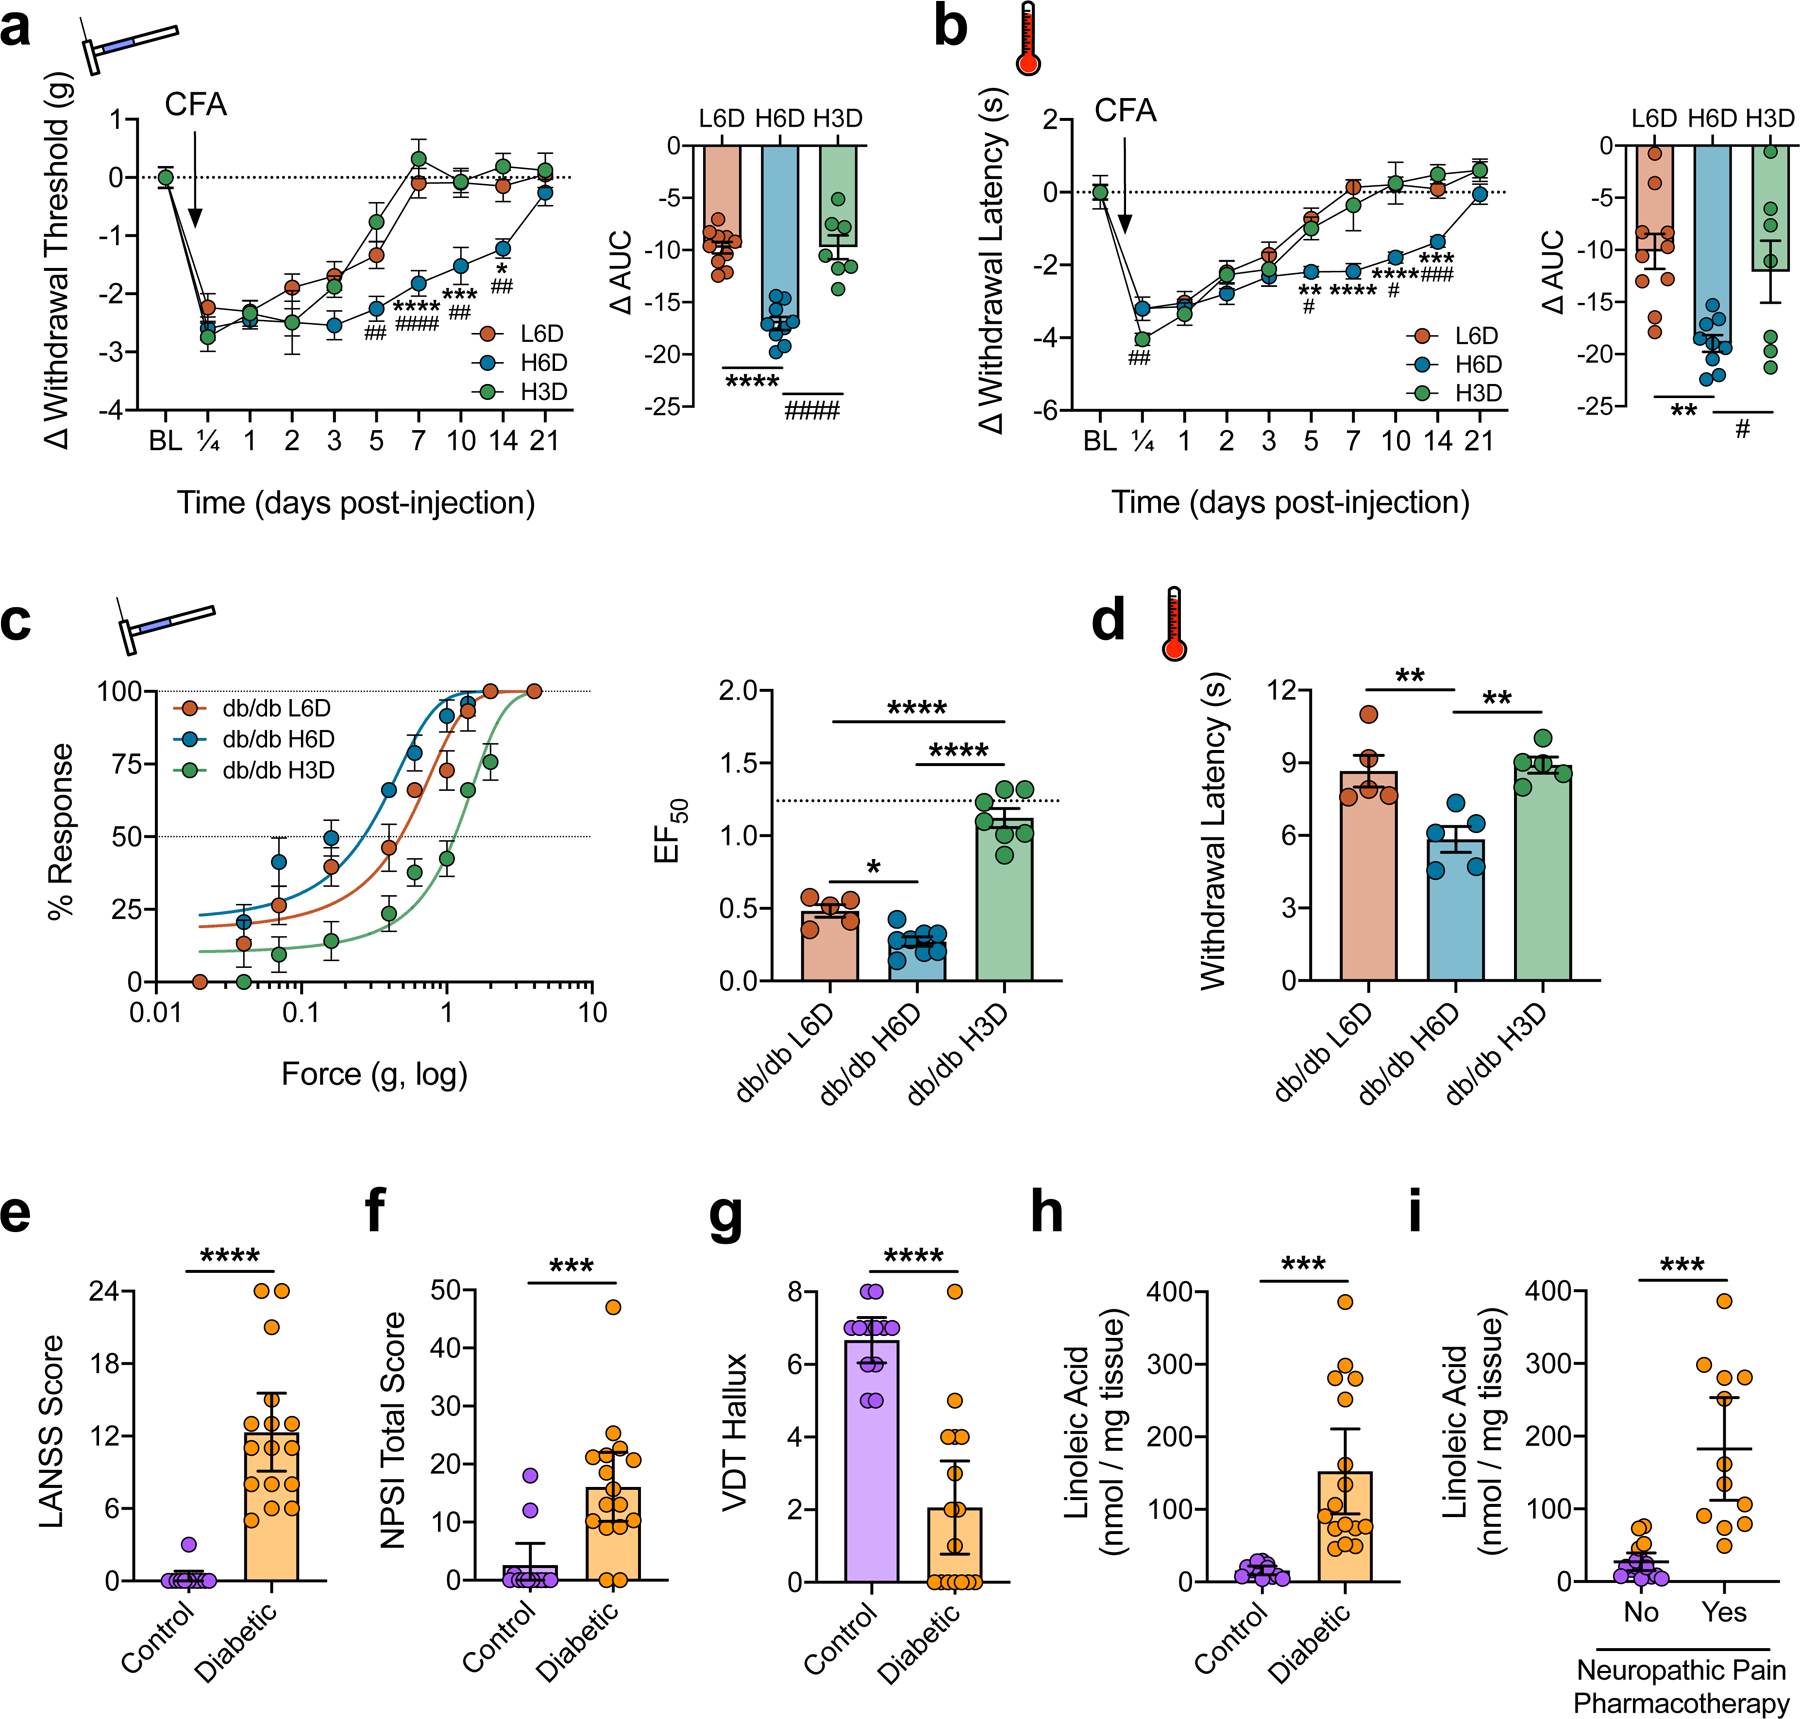
Diet-specific modulation of nociceptive behaviors associated with inflammatory and neuropathic pain. a,b, Time course of L6D-, H6D-, and H3D-specific changes to withdrawal responses from mechanical (a) and heat (b) stimulation following administration of Complete Freund’s Adjuvant (CFA). Change from baseline was calculated for each mouse since mean pre-CFA baselines differed across groups. Right (a,b): Areas under the curve (L6D, n=10; H6D, n=9; H3D, n=7). Time courses (comparisons to H6D): ####P<0.0001 H3D-7 (a), ##P=0.0013 H3D-5 (a), ##P=0.0021 H3D-10 (a), ##P=0.0032 H3D-14 (a), ****P<0.0001 L6D-7 (a), ***P=0.0005 L6D-10 (a), *P=0.0334 L6D-14 (a), ###P=0.0003 H3D-14 (b), #P=0.0174 H3D-5 (b), #P=0.0266 H3D-10 (b), ****P<0.0001 L6D-7/10 (b), ***P=0.0013 L6D-14 (b), **P=0.0021 L6D-15 (b). AUCs (comparisons to H6D): ####P<0.0001 H3D (a), ****P<0.0001 L6D (a), #P=0.0472 H3D (b), **P=0.0045 L6D (b). c, Mechanical force-response curves (left) with EF50 values (right) determined with nonlinear regression for 12-week-old db/db mice fed either the L6D, H6D, or H3D for 6 weeks (L6D, n=5; H6D, n=8; H3D, n=7). The dotted line (EF50 plot) reflects the historical mean EF50 value for C57BL6/J mice on the L6D. ****P<0.0001 L6D/H6D vs H3D, *P=0.0244 L6D vs H6D. d, Paw withdrawal latencies to radiant heat stimulation. **P=0.0064 L6D vs H6D, 0.0035 H3D vs H6D. e-g, Scatter plots of LANSS Pain Scale scores (e), NPSI total scores (f), and hallux vibration detection thresholds (g, a.u.) for control (purple) and diabetic neuropathy (orange) subjects (control, n=12; diabetic, n=16). ****P<0.0001 (e,g), ***P=0.0005 (f). h,i, Total LA content in skin biopsies from the lateral malleolus. Subjects are grouped based on diagnosis (h) or whether they are actively prescribed a neuropathic pain pharmacotherapy regimen (i). ***P=0.0002 (h), 0.0005 (i). Data are mean ± SEM (a-d) or mean ± 95% confidence intervals (e-i). Error bars for some data points are within the size of the symbol. Statistical tests used were two-way ANOVA with Geisser-Greenhouse’s correction and Tukey’s post-hoc test (atime,btime), one-way ANOVA with Tukey’s post-hoc test (aAUC,bAUC,c,d), unpaired two-tailed Mann-Whitney (e-g), and unpaired two-tailed Student’s t test (h,i).