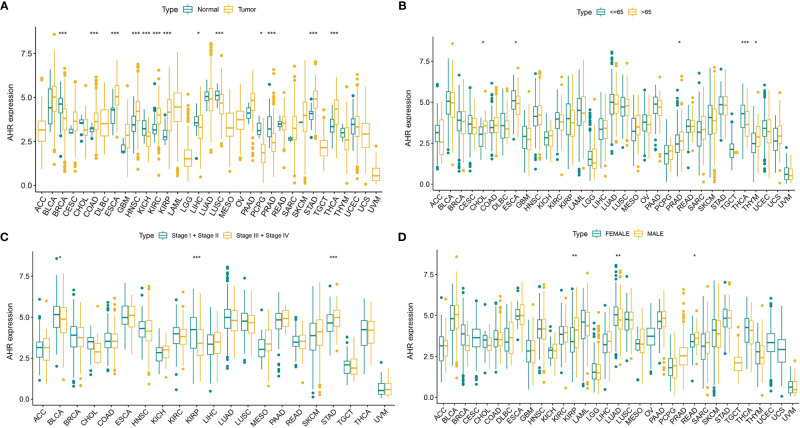
Figure 2.
The clinical correlation of AhR. (A) shows the differential expression analysis between tumor and normal groups of AhR in 33 cancers; (B) represents the correlation between age and AhR; (C) demonstrates the correlation between tumor stage and AhR; (D) shows the correlation between gender and AhR. “*” indicates p < 0.05, “**” indicates p < 0.01 and “***” indicates p < 0.001.

