
Figure 4.
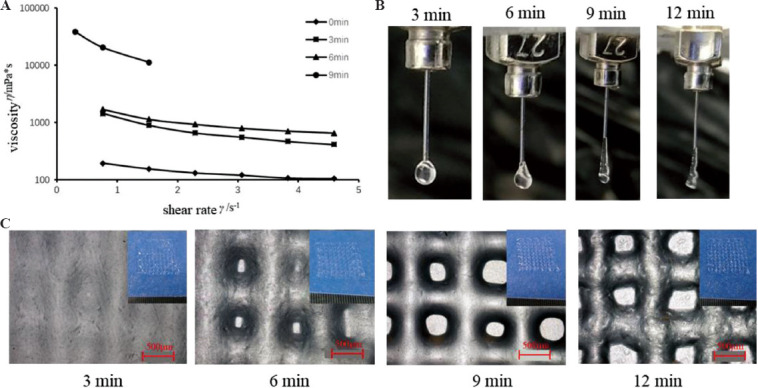
Effect of different pre-cooling time at 4°C on the performance of the G6A1C1 bio-inks. (A) Curve of viscosity and shear rate of the mixed bio-inks. (B) Outflow state of the bio-inks. (C) The micro-morphology of the printed structures printed by the bio-inks with different pre-cooling time.