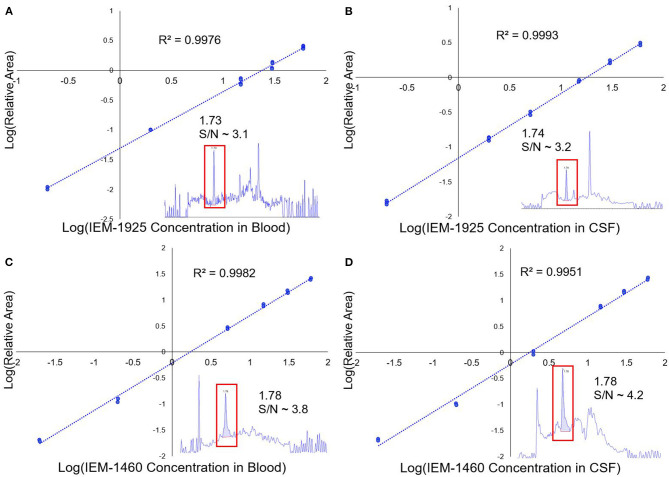
Figure 2.
LC/MS calibration curves for IEM-1925 and IEM-1460. (A) The LC/MS calibration curve showing the relative area of IEM-1925 to internal standard (verapamil) in blood is plotted against IEM-1925 concentration. Replicates for each concentration were obtained with duplicate injections. The 1 ng/mL standard in blood chromatogram with S/N ~ 3.1 is shown in the inset that eluted at 1.73 min. (B) Similarly, LC/MS calibration curve showing IEM-1925 in CSF matrix is plotted against the internal standard. The 1 ng/mL standard in CSF with S/N ~3.2 is shown in the inset eluting at 1.74 min. (C) IEM-1460 calibration curve in blood with inset showing 1 ng/mL IEM-1460 in blood with S/N ~3.8 eluting at 1.78 min. (D) IEM-1460 calibration curve in CSF with inset showing 1 ng/mL IEM-1460 in CSF with S/N ~ 4.2 eluting at 1.78 min.

