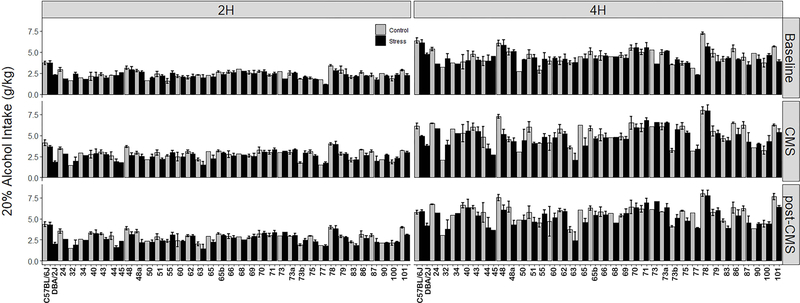
Figure 2. Average Strain Alcohol Intake Over All Periods.
Left and right panel display 2h and 4h intake, respectively. Intake for each period is shown in rows. Alcohol (20%) intake in grams of alcohol per kilogram body weight is shown on the y-axis. Strains are shown on the x-axis. Intake for control and stress group are displayed for each strain.

