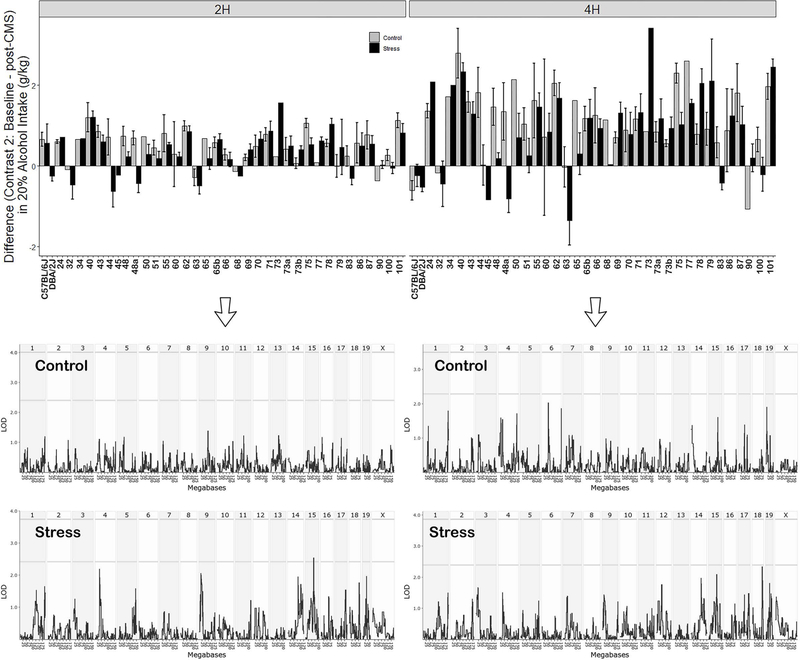
Figure 4. Average Strain Difference in Intake for Contrast 2 (Baseline – post-CMS Periods).
Left and right panel display 2h and 4h intake, respectively.. Alcohol (20%) intake in grams of alcohol per kilogram body weight is shown on the y-axis. Strains are shown on the x-axis. Intake for control and stress group are displayed for each strain. Below each bar graph is the corresponding interval map for the Control and Stress groups. The strength of the association (logarithm of the odds or LOD score) is plotted on the y-axis across the genome (x-axis). The threshold for genome-wide significance or suggestive loci based on permutation is shown by the upper and lower horizontal lines, respectively.

