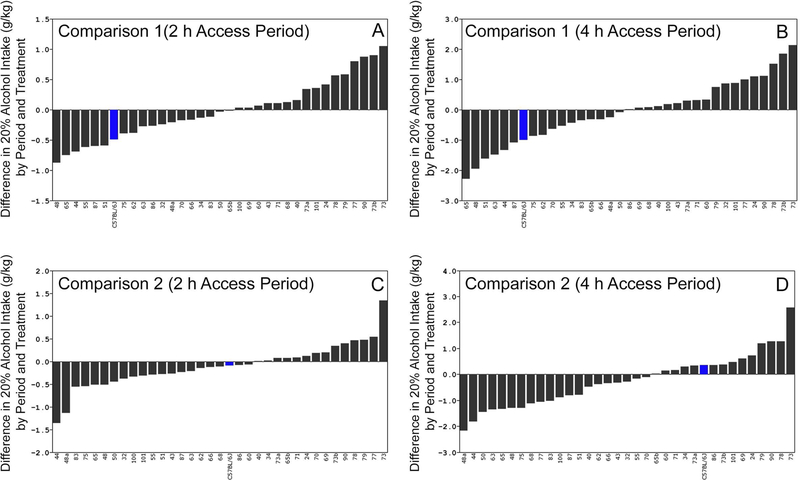
Figure 5. Strain Distribution of Differences for Comparisons 1 and 2.
Consumption (g/kg) represented as mean difference score on the y-axis and strain shown on the x-axis. B6 and D2 filled in blue and red, respectively. Strain distributions organized by rank for each trait. Error bars not shown for difference of differences. Difference in consumption due to chronic stress (Comparison 1) shown in A for 2h intake and B for 4h intake. Difference in consumption following chronic stress shown in C for 2h intake and D for 4h intake. (A) Comparison 1 for 2h intake, CMS group minus control and CMS period (mean of 7 weeks) minus Baseline (mean of 5 weeks). (B) Differences in 4h DID, stress group minus control and CMS period minus Baseline period. (C) Comparison 2, strain distribution of differences in 2h DID, CMS group minus control and post-CMS period minus Baseline. (D) Strain distribution of differences in 4h DID, CMS group minus control and post-CMS period minus Baseline. For Comparison 2, most strains demonstrate a decrease in intake associated with chronic stress relative to baseline (negative value). Some strains, notably BXD73, demonstrate increased voluntary alcohol intake during CMS (Comparison 1) and following CMS (Comparison 2).

