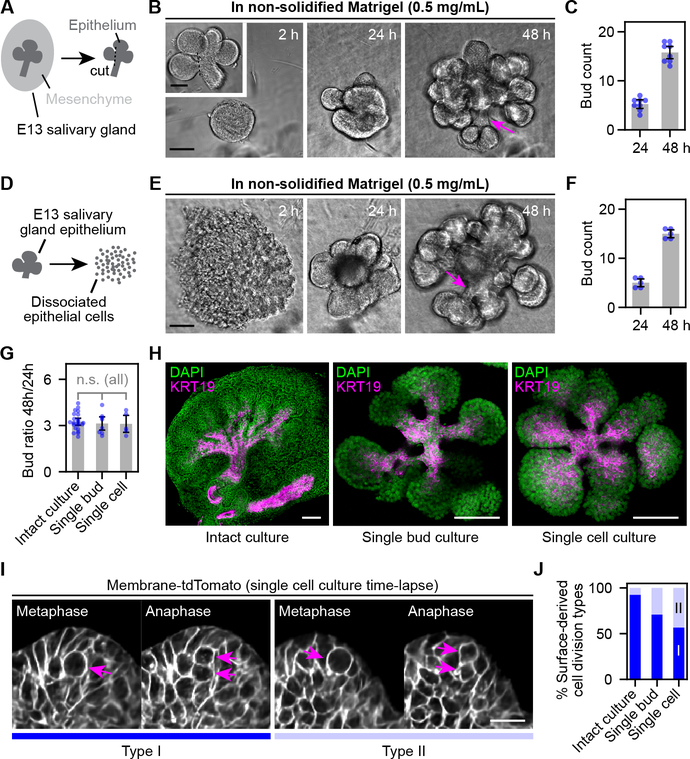
Figure 5. Reconstitution of epithelial branching morphogenesis using primary salivary gland epithelial cells.
(A, D) Schematics of single-bud (A) and single-cell (D) isolation from E13 salivary glands. (B, E) Phase contrast images at indicated time points from single-bud (B) or single-cell (E) cultures. Arrows point to ductal structures. (C, F) Plots of bud number of single-bud (C) or single-cell (F) cultures. (G) Plot of bud ratios at 48 h to 24 h of intact, single-bud and single-cell cultures. (H) Merged confocal (KRT19) and two-photon (DAPI) microscopy images of intact, single-bud and single-cell cultures. KRT19 is a duct marker. (I-J) Time-lapse two-photon images (I) and stacked bar plot (J) showing two types of surface-derived cell divisions observed in single-cell and single-bud salivary gland cultures. Arrows in (I), dividing cells. Data for intact culture in (J) is the same as Fig. 2A. Error bars, 95% confidence intervals. Scale bar in (I), 20 μm; others, 100 μm.

