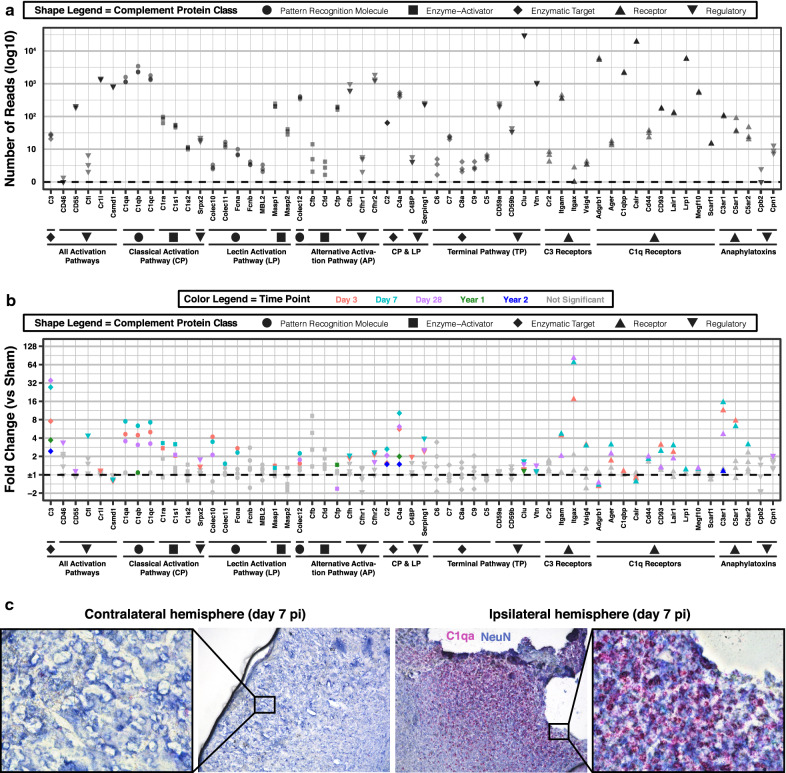
Fig. 3.
Complement genes show extensive and chronic dysregulation in TBI. a Quantification of the number of reads of complement genes in normal 12-week-old brain samples (custom-built NanoString panel). Complement genes are organized in order by complement pathway (in text) and class (shape legend). b Quantification of fold change in expression of complement genes in injured brains at 3 days, 7 days, 28 days, 1 year, and 2 years after TBI compared to age-matched uninjured controls. FDR was computed only for genes with p value < 0.05 to increase sensitivity at chronic time points. N = 3 per group. c Combination of IHC for NeuN (blue) and RNAscope in situ hybridization for C1qa gene (red puncta) in TBI brains at days 7 after injury. N = 3 per group. Shown is a representative image of the contralateral and ipsilateral hemisphere in the same animal at 10 × magnification. The boxed areas on both hemispheres are shown at 40 × magnification

