
Figure 5. Methylation silences DINO in human cancers.
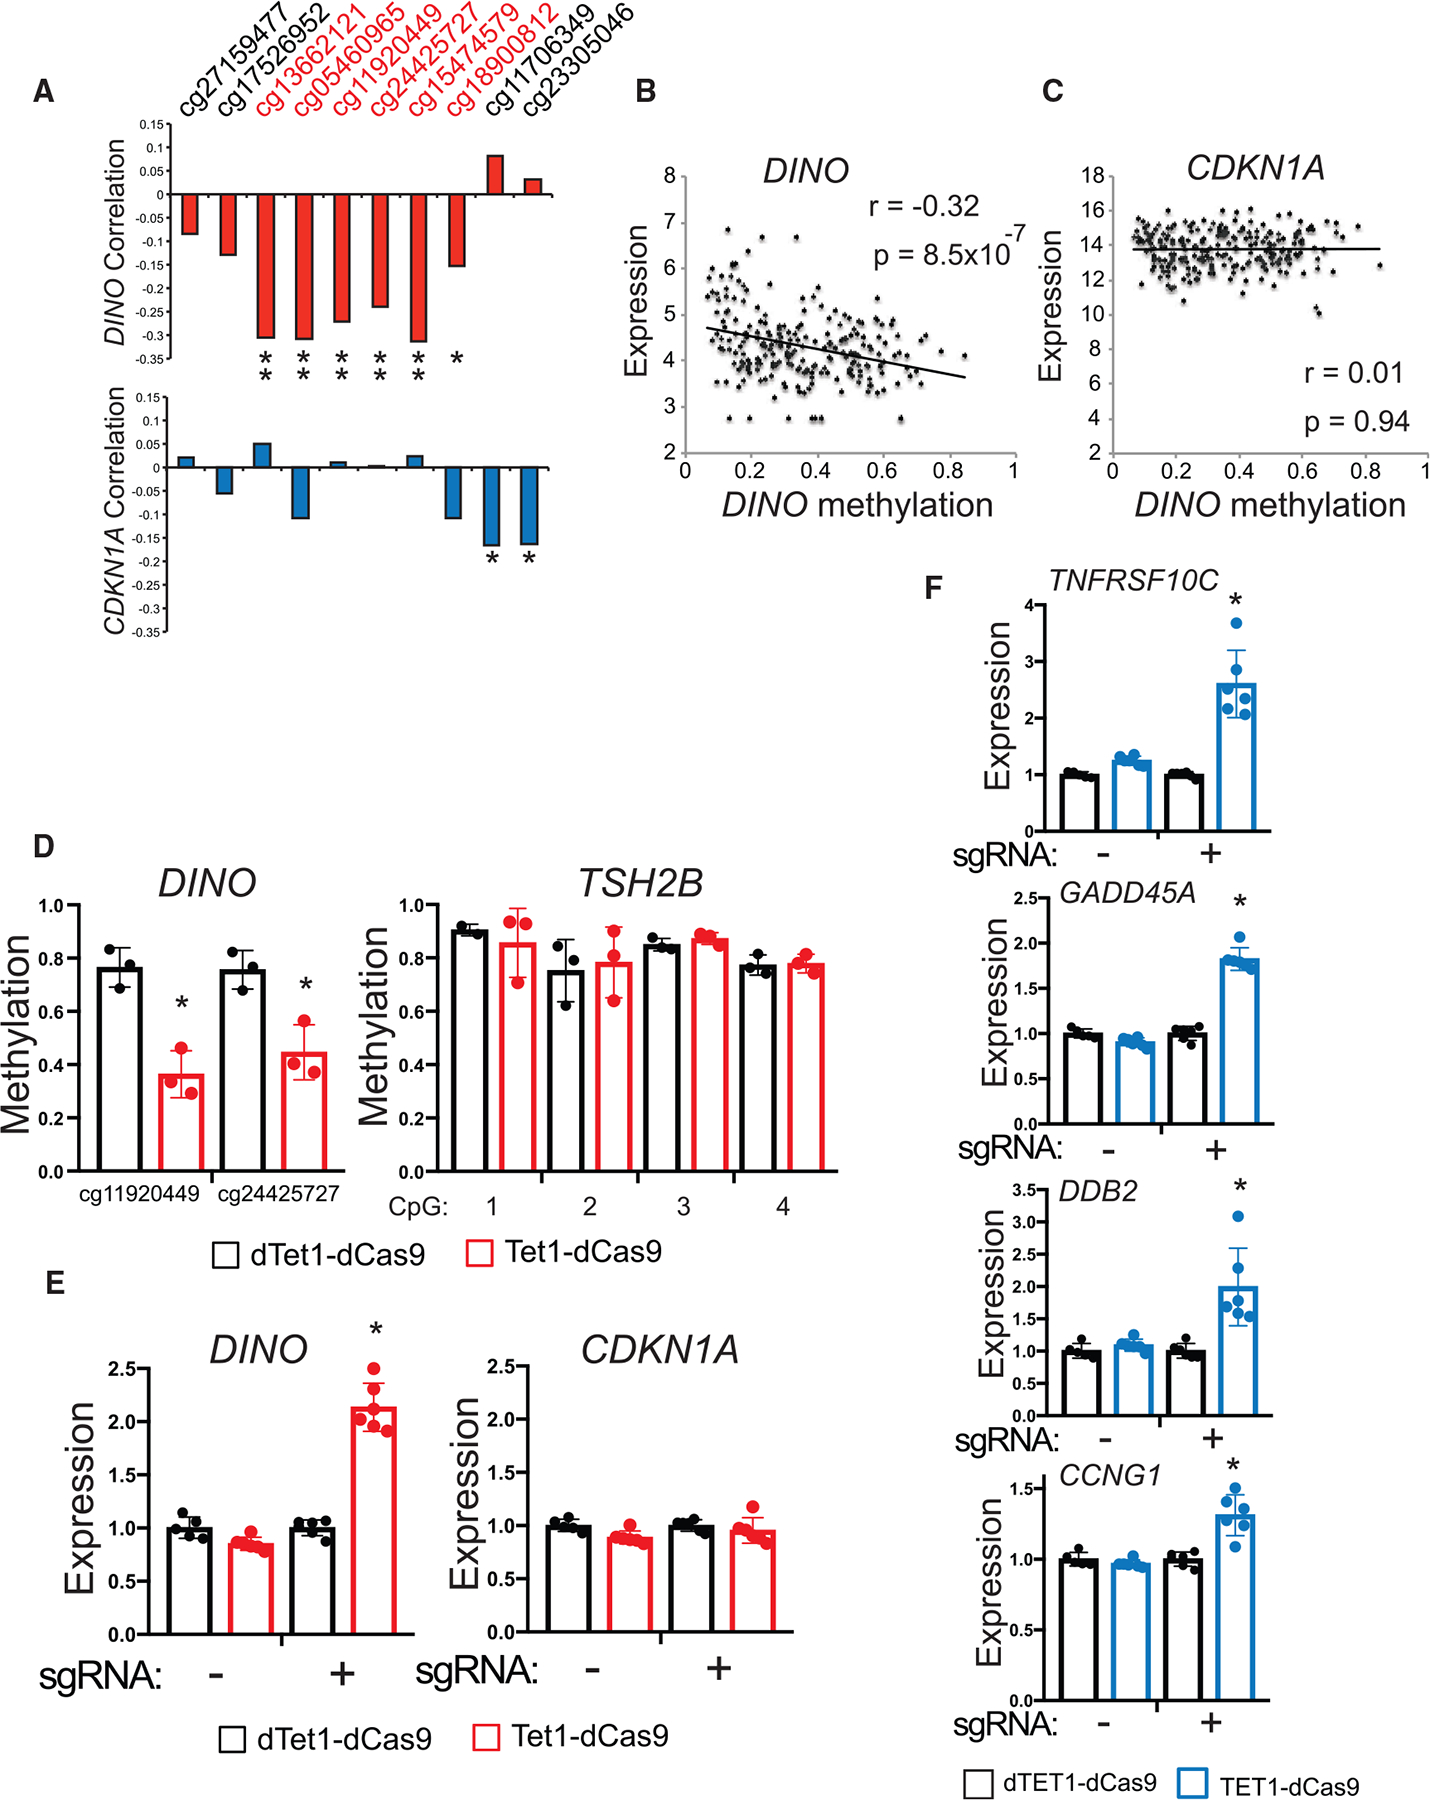
(A) Correlation coefficient for methylation at each CpG near the DINO DMR with DINO and CDKN1A expression in SARC samples, (DINO correlation: cg13662121 p = 3 × 10⁻⁶, cg05460965 p = 2 × 10⁻⁶, cg11920449 p = 3 × 10⁻⁵, cg24425727 p = 3 × 10⁻⁴, cg15474579 p = 1 × 10⁻⁶, cg18900812 p = 0.02; CDKN1A correlation: cg11706349 p = 0.01, cg23305046 p = 0.01). Pearson correlation two-tailed p value.
(B) Correlation of average DINO methylation with DINO expression in SARC (r = −0.32, p = 8.5 × 10⁻⁷). Pearson correlation two-tailed p value.
(C) Correlation of average DINO methylation with CDKN1A expression in SARC (r = 0.01, p = 0.94). Pearson correlation two-tailed p value.
(D) Methylation as measured by bisulfite sequencing at CpGs within the DINO DMR and TSH2B CpG island in HT-1080 cells. Cells were infected with lentivirus expressing either TET1-dCas9 or dead TET1-dCas9 (dTET1-dCas9) and a sgRNA targeting the DINO DMR. Above: map of the location of sgRNA within the DINO DMR. (mean ± SD, cg11920449, p = 0.004, cg24425727, p = 0.01, two-tailed t test).
(E) Expression of DINO and CDKN1A in HT-1080 cells stably expressing TET1-dCas9 or dTET1-dCas9 with or without a sgRNA targeting the DINO DMR. (mean ± SD, *p = 3.9 × 10⁻⁷, two-tailed t test).
(F) Expression of select p53-regulated genes located on different chromosomes than the DINO/CDKN1A locus. (mean ± SD, TNFRSF10C p = 6.4 × 10⁻⁵, GADD45A p = 8.7 × 10⁻⁸, DDB2 p = 0.0027, CCNG1 p = 0.0006, two-tailed t test).
See also Figure S5.