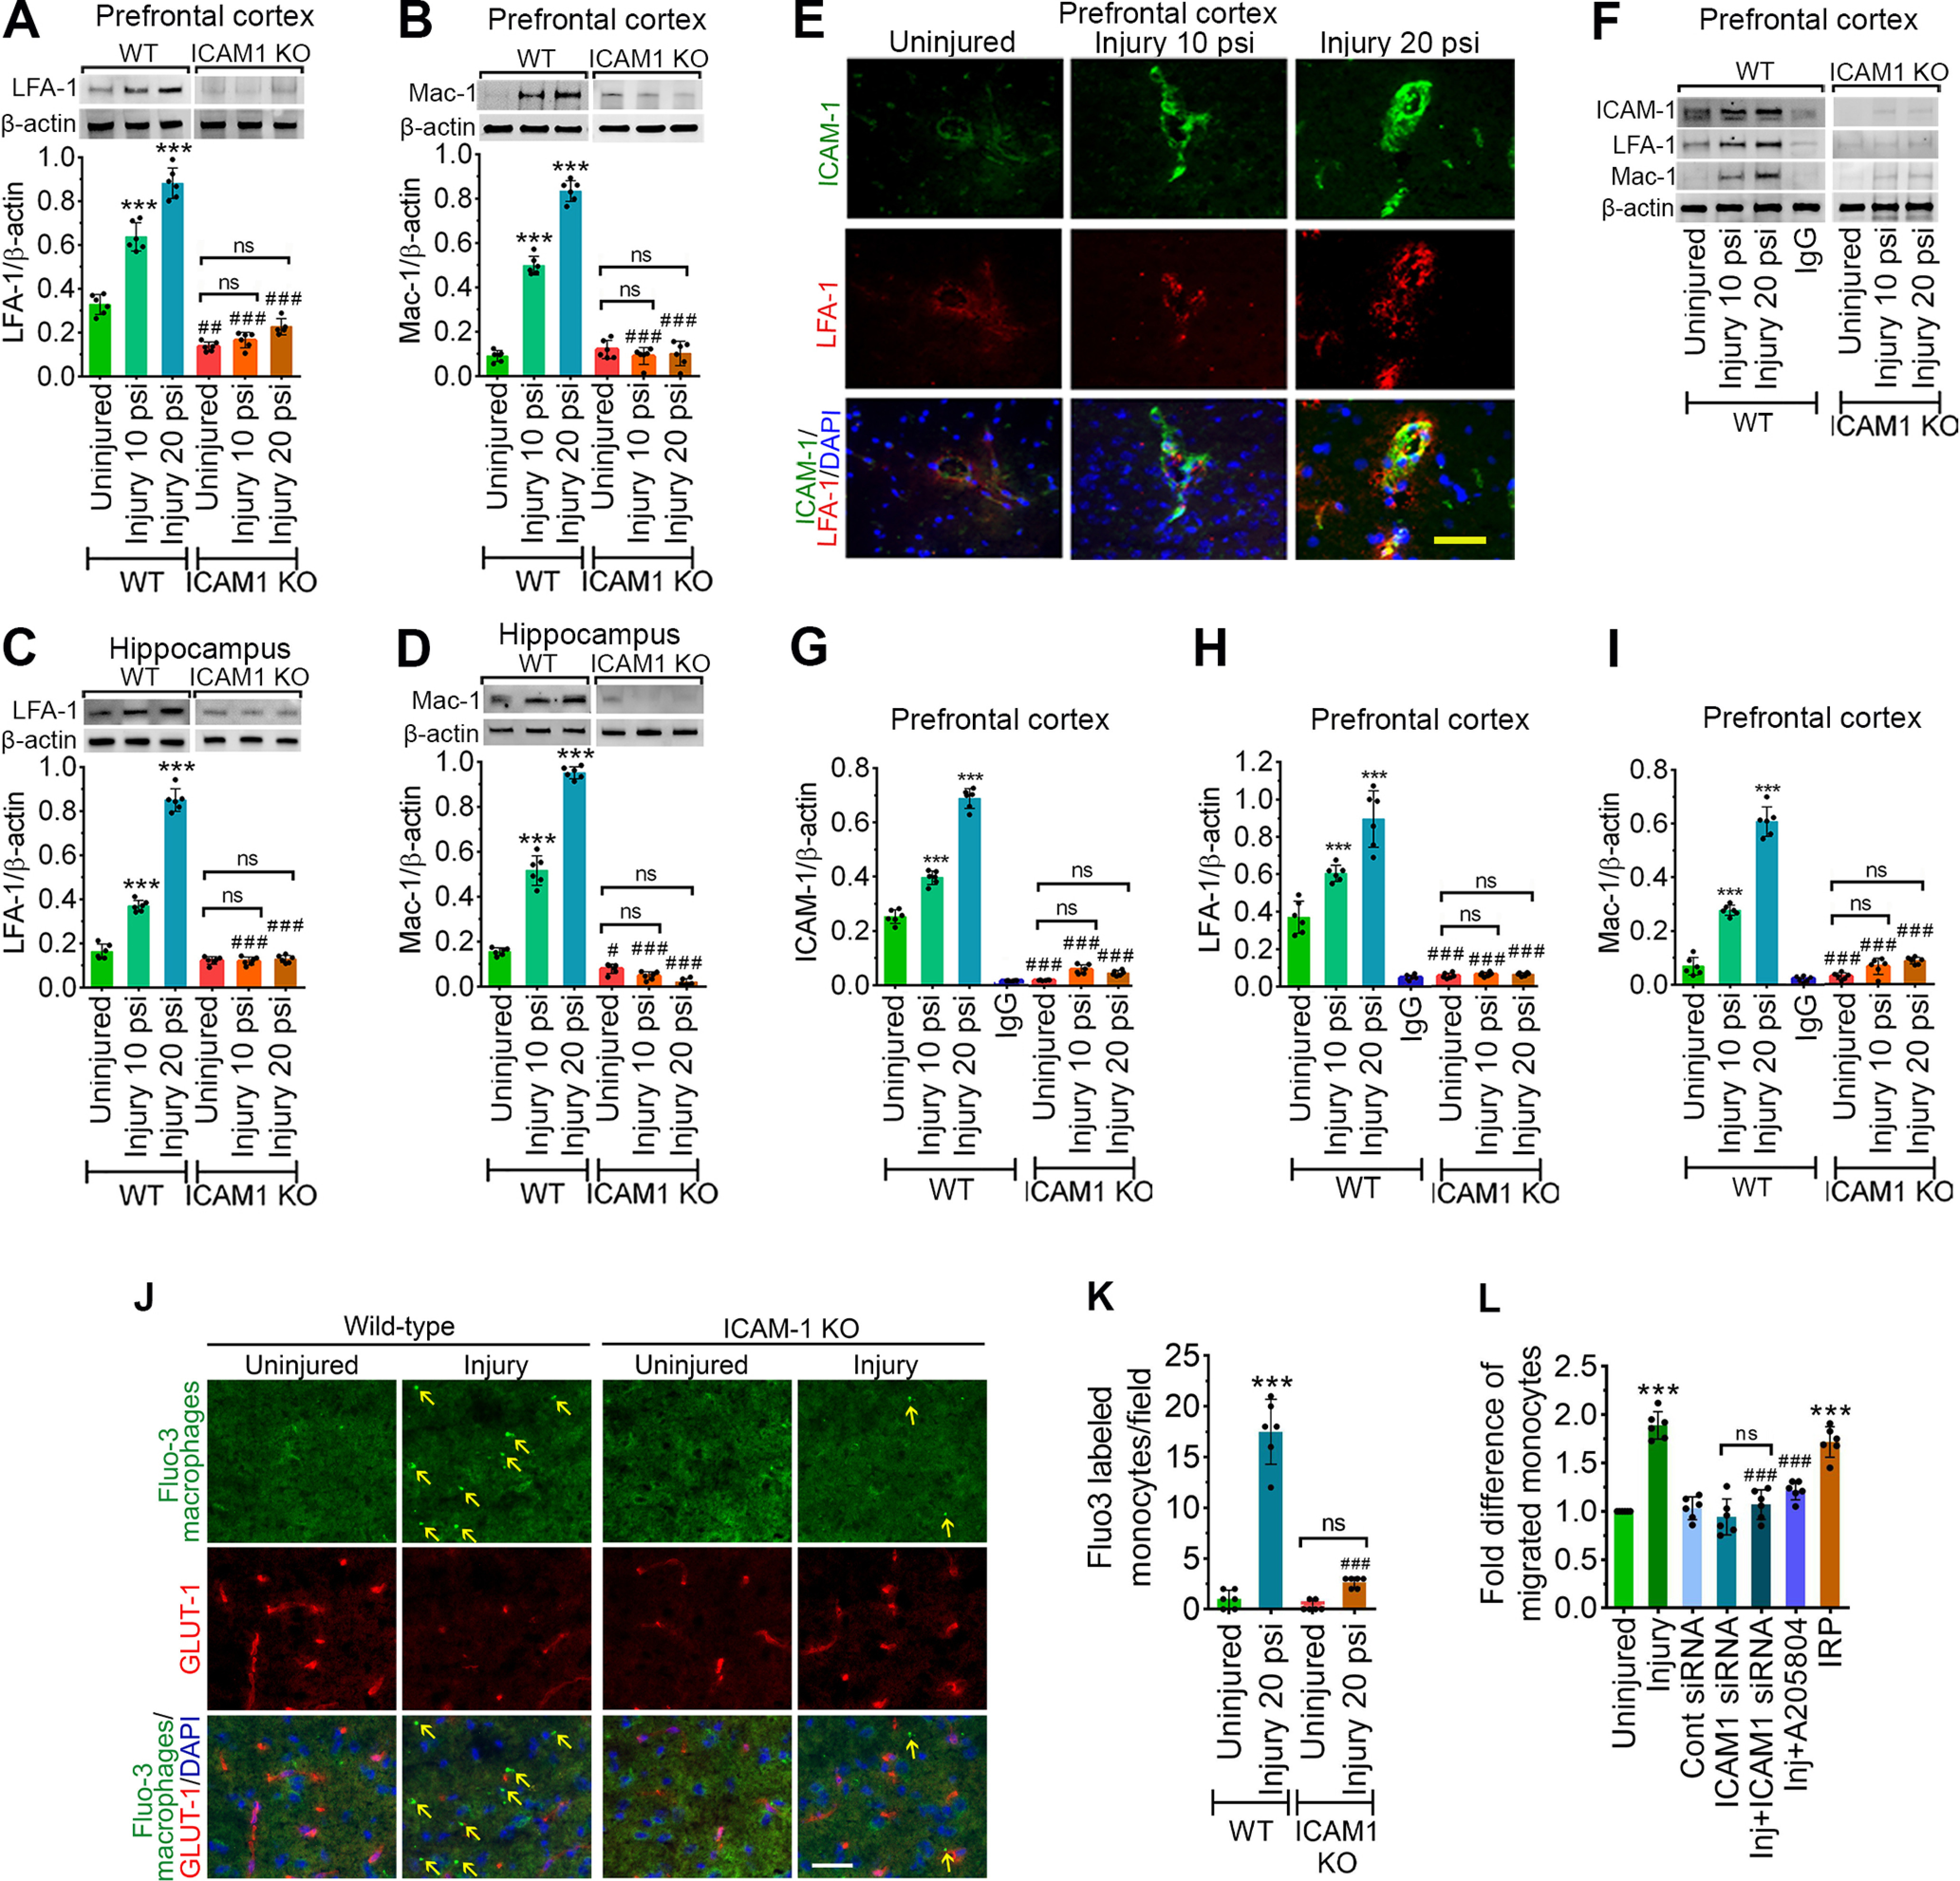
Figure 3.

TBI enhances the activation of LFA-1 or Mac-1 with ICAM-1 and promotes transmigration of leukocytes. A, B, Western blotting of LFA-1 (A), Mac-1 (B), and β-actin following 10 and 20 psi FPI in the prefrontal cortical tissue lysates of WT and ICAM-1−/− mice. Bar graph represents the densitometric ratio of LFA-1 or Mac-1 bands versus β-actin bands (n = 6/group). C, D, Western blotting of LFA-1 (C), Mac-1 (D), and β-actin in the hippocampal tissue lysates of WT and ICAM-1−/− mice. Bar graph represents the densitometric ratio of LFA-1 or Mac-1 bands versus β-actin bands (n = 6/group). E, Immunofluorescent staining of ICAM-1 (green) merged with LFA-1 (red) and DAPI (blue) in WT mice 48 h after 10 and 20 psi FPI (n = 4). F, Western blotting of ICAM-1, LFA-1, Mac-1, and β-actin 48 h after 10 and 20 psi FPI in the tissue lysates immunoprecipitated with ICAM-1 mAb. Anti-IgG antibody was used as a negative control (fourth lane in WT blots). G–I, Bar graphs show the densitometric ratio of ICAM-1 (G), LFA-1 (H), and Mac-1 (I) bands versus β-actin bands (n = 6/group). J–L, In vivo and in vitro analysis of transmigration of leukocytes across the BBB. Fluo3-labeled macrophage adhesion/migration in brain capillary after infusion of cells into the common carotid artery (J), and the quantification of Fluo3-labeled cells in the brain part (K). L, Migration of monocytes across the in vitro model of BBB after treatment of various test compounds as shown in figure (n = 6/group). All values are expressed as mean ± SD two-way ANOVA followed by Bonferroni post hoc tests. Statistically significant ***p < 0.001 versus WT uninjured group; ##p < 0.01, ###p < 0.001 uninjured versus uninjured, 10 versus 10 psi, and 20 versus 20 psi between WT and KO groups; ns = non-significant.
