Figure 6.

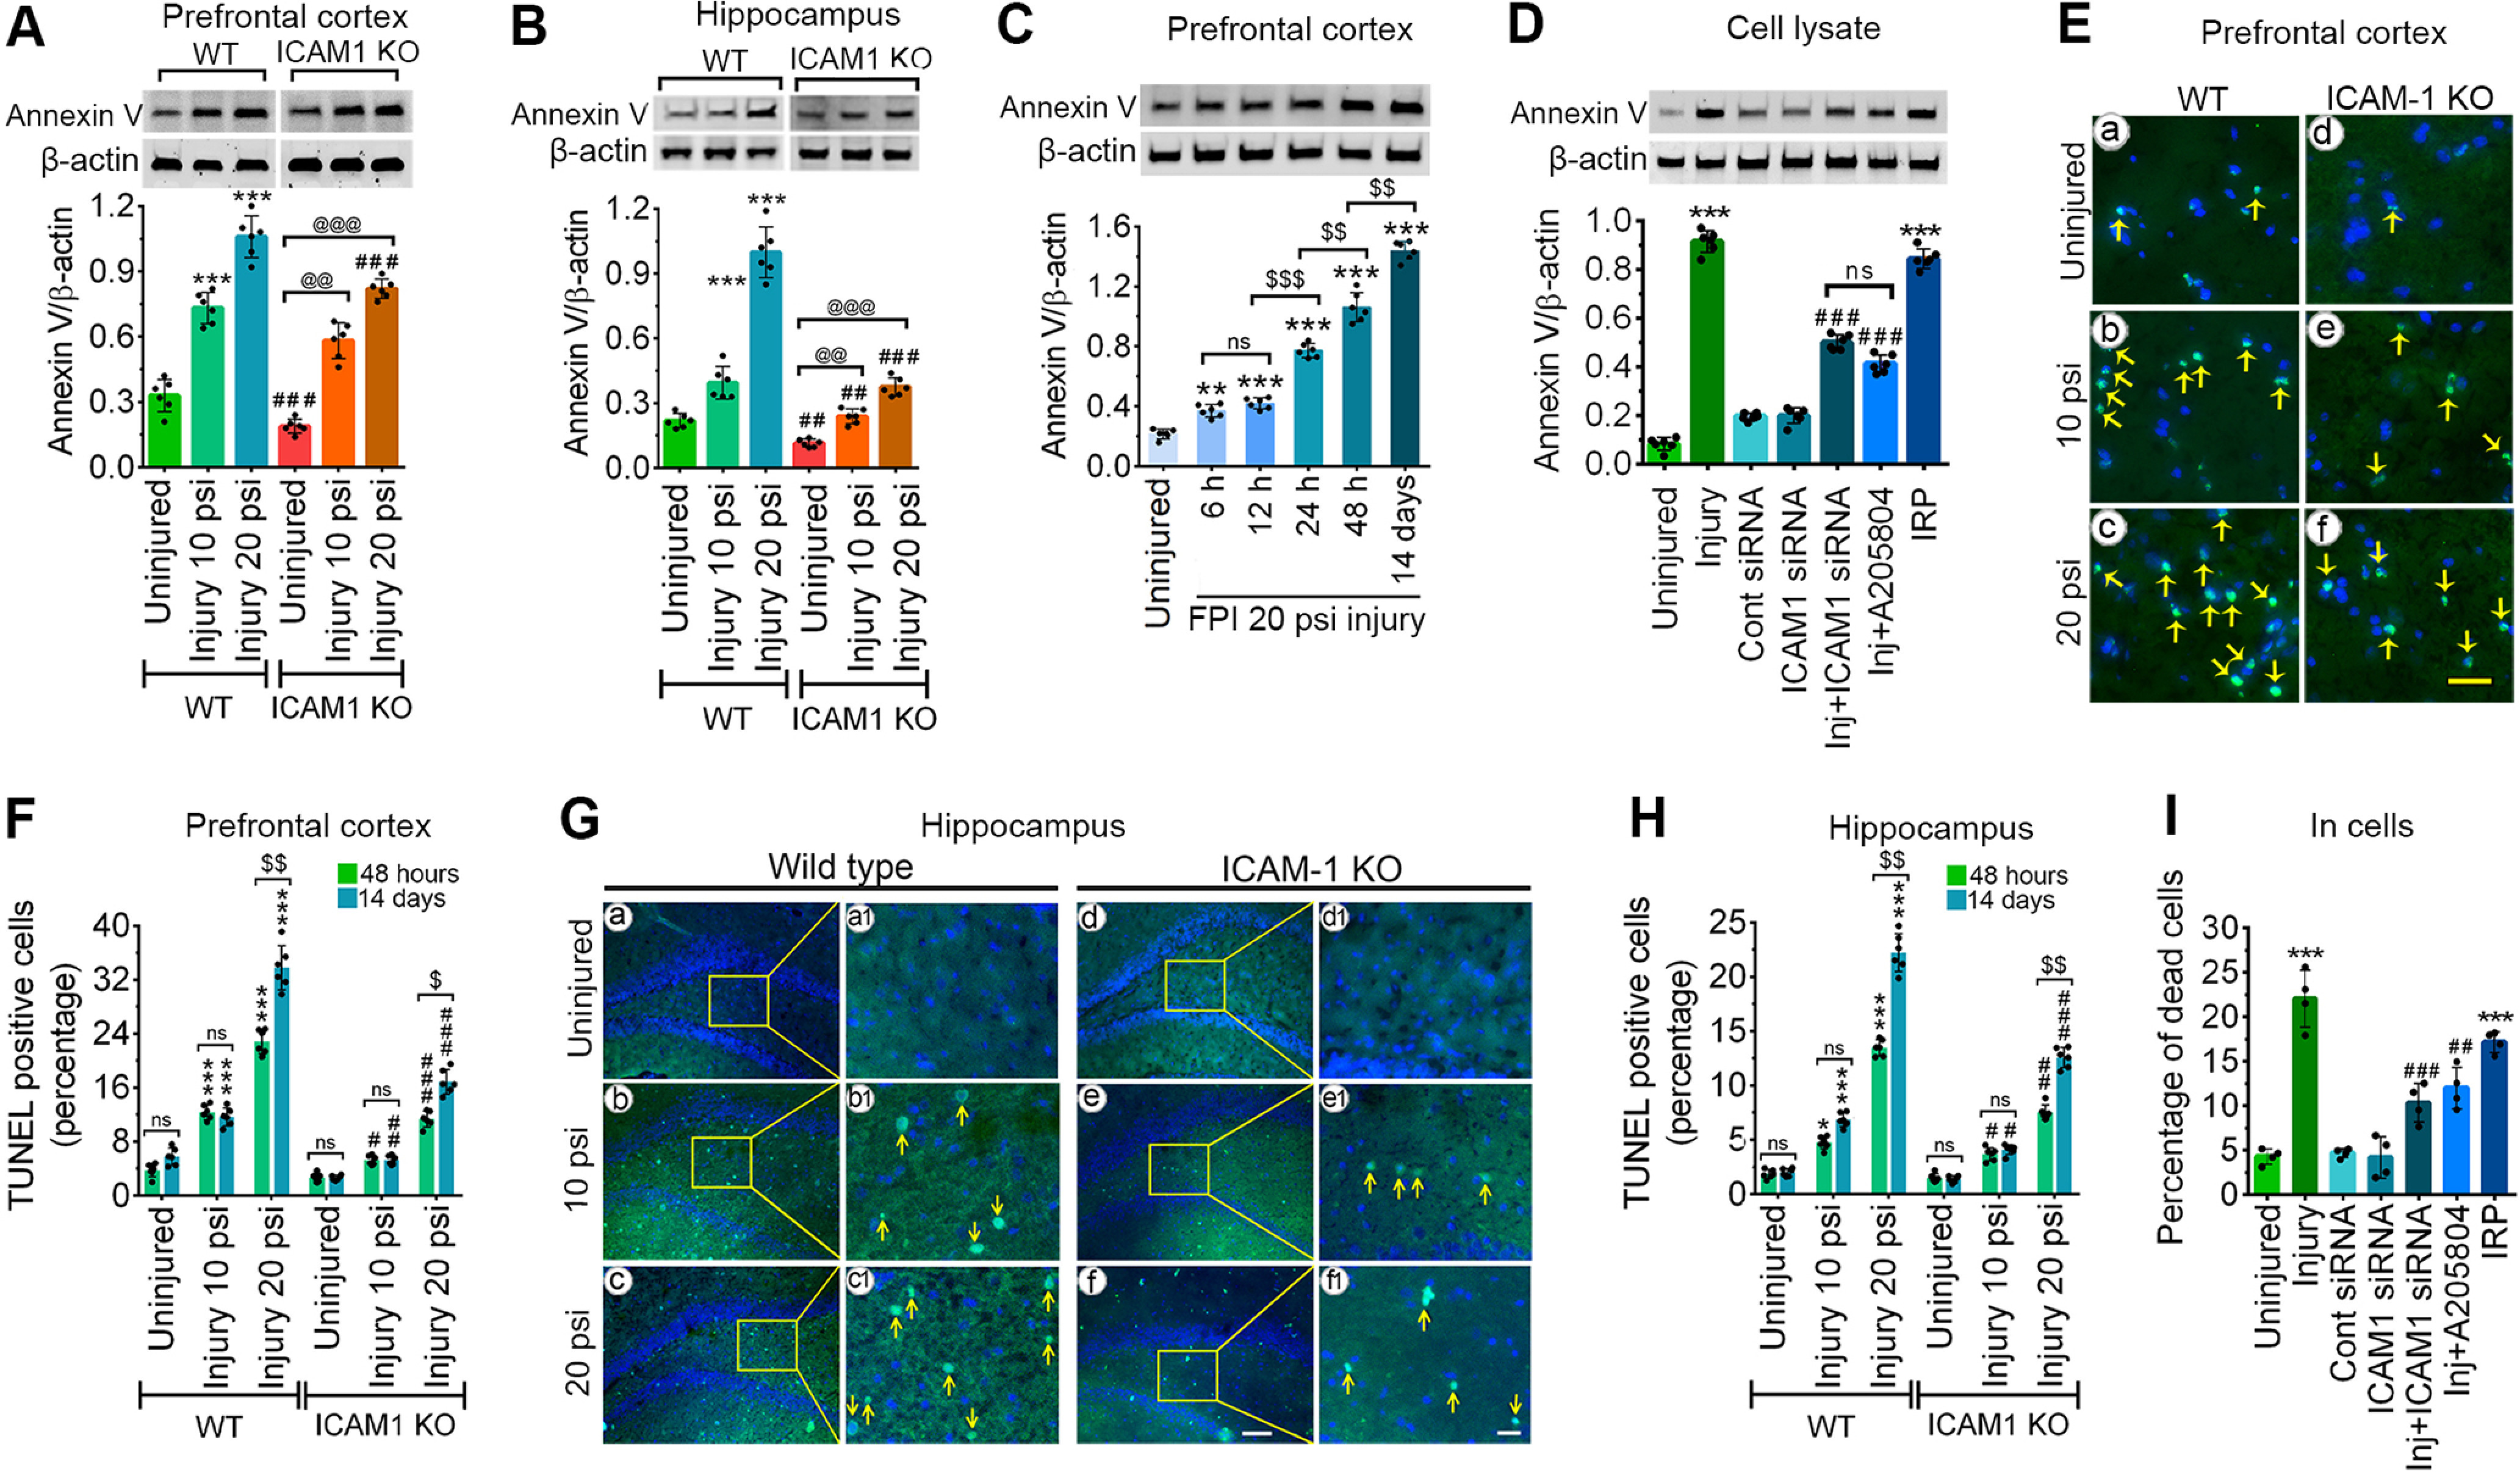
ICAM-1 activation induces cell death in animal and cell models of TBI. A, B, Western blotting of Annexin V and β-actin in tissue lysates of PFC (A), hippocampus (B) of WT and ICAM-1−/− mice 48 h after 10 and 20 psi FPI. C, Western blotting of Annexin V and β-actin at different time points in the PFC 48 h after injury. D, Western blotting of Annexin V and β-actin in the cell lysates of hBMVEC 24 h after 3.0 psi stretch injury. Bar graph represents the densitometric ratio of cl-caspase-3 bands versus β-actin bands (n = 6/group). E, G, Representative TUNEL staining (green) images 48 h after 10 and 20 psi FPI in the PFC (E) and hippocampus (G). Scale bar: 25 μm (E), 100 μm (G, bigger panels a–f), and 20 μm (G, enlarged panels a1–f1); n = 6/group. F, H, Percentage of apoptotic-positive cells in the PFC (F) and hippocampus (H). I, Trypan blue staining represented as a percentage of dead cell analyzed 24 h after 3.0 psi stretch injury in hBMVEC (n = 4/group). All values are expressed as mean ± SD one-way ANOVA for C, D, one-way and two-way ANOVA for A, B, F, H followed by Bonferroni post hoc tests. Statistically significant *p < 0.05, **p < 0.01, ***p < 0.001 versus WT uninjured group in B–D, F–I and versus uninjured hBMVEC in E, J; #p < 0.05, ##p < 0.01, ###p < 0.001 versus corresponding WT injury groups in B–D, F–I and versus injured hBMVEC in E, J; @p < 0.05, @@p < 0.01, @@@p < 0.001 versus uninjured ICAM-1−/− group in B–D, F–I; $p < 0.05, $$p < 0.01 between 48 h and 14 d postinjury in G, I and between two time frames in D; ns = non-significant.
