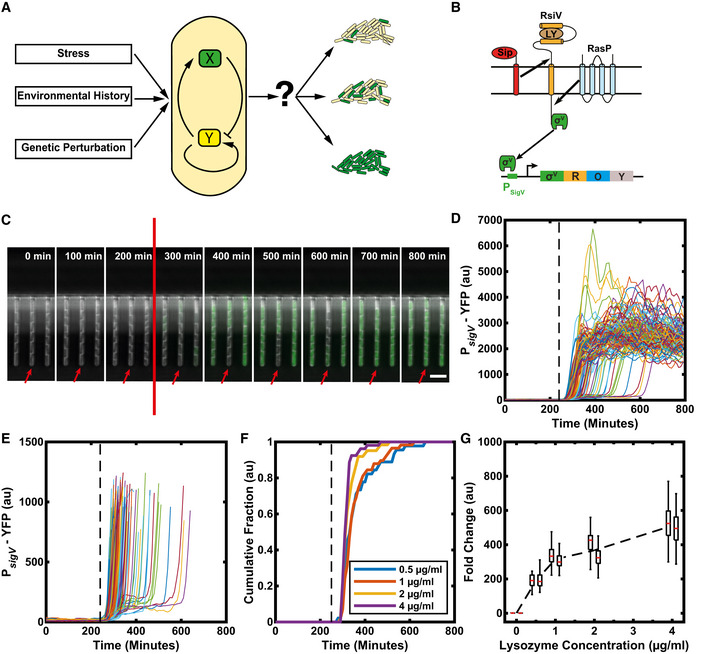
Figure 1. σV is activated heterogeneously in response to lysozyme stress.

-
AIt is unclear how genetic circuits (centre) tune phenotypic variability in a bacterial population in response to genetic perturbation, environmental stress and history (left) to modulate the fraction of cells that activate a given pathway (right).
-
BSchematic of the σV circuit. In its inactive form, σV is bound to its anti‐sigma factor RsiV. If there is lysozyme present in the environment, RsiV binds to lysozyme and undergoes a conformational change. Only then the proteases SipS/ SipT and RasP can cleave RsiV to release σV. Once σV is released from RsiV, it can bind to RNA polymerase to redirect transcription to the σV regulon. σV can initiate transcription of its own operon which includes sigV (σV), rsiV (R), oatA (O, one of the main lysozyme resistance genes) and yrhK (Y, unknown function).
-
CTime‐lapse microscopy of cells containing a P sigV ‐YFP promoter reporter reveals heterogeneous activation of σV in response to lysozyme stress. The stress (red line) was added between the 200 and 300 min time points (at 240 min). The red arrow highlights a cell with a delayed activation of σV. Scale bar: 5 μm.
-
DTime traces of mean YFP fluorescence per cell. Each trace represents a single‐cell lineage's response to 1 µg/ml lysozyme. (109 traces from two independent experiments). Lysozyme added at the black dashed line.
-
EFigure D replotted to allow examination of variable activation times.
-
FThe observed heterogeneity is reduced with increasing stress levels. Each line represents the cumulative fraction of cells (N = ˜ 50) with P sigV ‐YFP values that are higher than the half maximum of their final values (representing cells that have activated).
-
GThe fold change in mean YFP fluorescence increases with increasing stress levels, shown for two biological repeats (adjacent boxplots). Each day's fold change distribution consisted of > 40 manually corrected single‐cell traces. On each box, the central mark indicates the median, and the bottom and top edges of the box indicate the 25th and 75th percentiles, respectively. The lower and higher whiskers of boxplot are extended to the first quartile minus 1.5 * interquartile range and the third quartile plus 1.5 * interquartile range, respectively. The black dashed line is the mean fold change.
Data information: For more information on the number of repeats, please see Appendix Table S3.
