. 2021 Jul 19;17(7):e9832. doi: 10.15252/msb.20209832

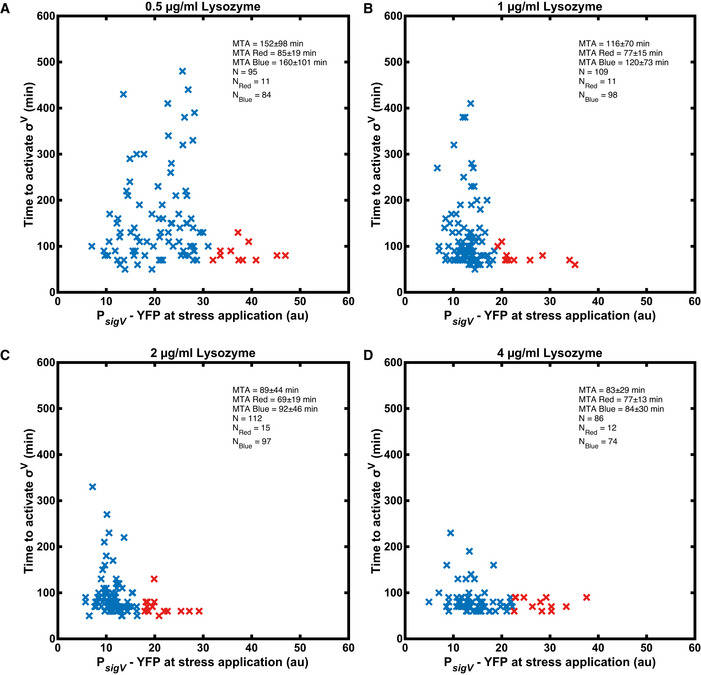
Figure EV2. Cells with high P sigVYFP before stress activate σV rapidly.

Figure EV2

Figure plots P sigV ‐YFP levels at the time of stress addition, against the time to activation. Cells with a YFP fluorescence larger than the mean + s.d. (of the pre‐stress YFP distribution) are marked with red crosses. All other cells are marked with blue crosses. In the inset MTA stands for mean time to activate.
  • A
    Activation time for 0.5 µg/ml lysozyme.
  • B
    Activation time for 1 µg/ml lysozyme.
  • C
    Activation time for 2 µg/ml lysozyme.
  • D
    Activation time for 4 µg/ml lysozyme.

Data information: All shown data in the plots are from two biological repeats. For more information on the number of repeats, please see Appendix Table S4.