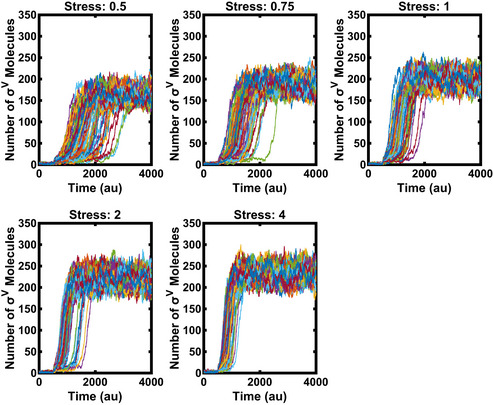
Figure EV4. With increasing stress levels, the heterogeneity in activation is reduced in the mathematical model.

Each line corresponds to one simulated cell. The stress was added (parameter L changed from 0 to 1) at time point 500 (N = 100).
Data information: For more information on the number of repeats, please see Appendix Table S4.
