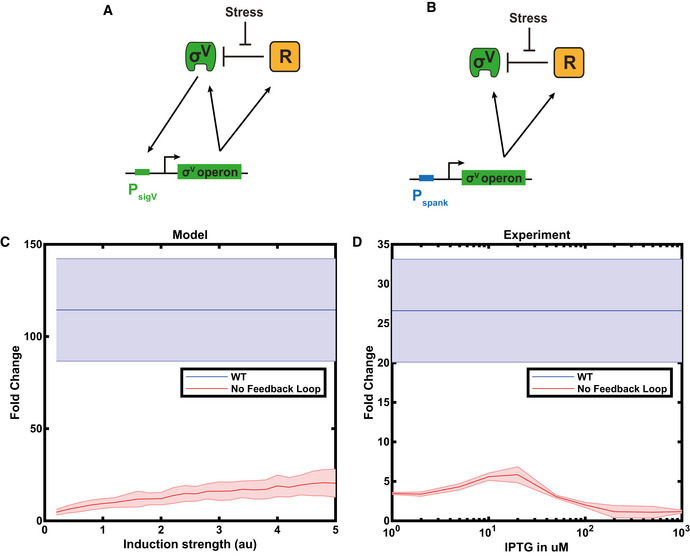
Figure EV5. The sigV feedback loop increases the dynamic range of the circuit.

-
ASketch of WT sigV circuit. Where R stands of RsiV.
-
BSketch of rewired circuit with deleted positive feedback loop. Where R stands for RsiV and Pspank for the IPTG inducible promoter spank.
-
CThe fold change in sigV expression pre/post 1 μg/ml lysozyme stress was calculated from model simulations of the WT system (blue line) and a feedback‐broken system where the levels of the sigV operon are inducible (red line). The shaded areas represent one standard deviation of mean. N = 100 simulation.
-
DThe experimental fold change for the WT, and the feedback‐broken strain for IPTG values between 0 to 1,000 μM. The blue line is the WT fold change, and the red line is the fold change of ΔsigVrsiVoatAyrhK P spank ‐sigVrsiVoatAyrhK. The shaded areas represent one standard deviation of mean. n = 3 biological repeats for all data shown.
Data information: For more information on the number of repeats, please see Appendix Table S4.
