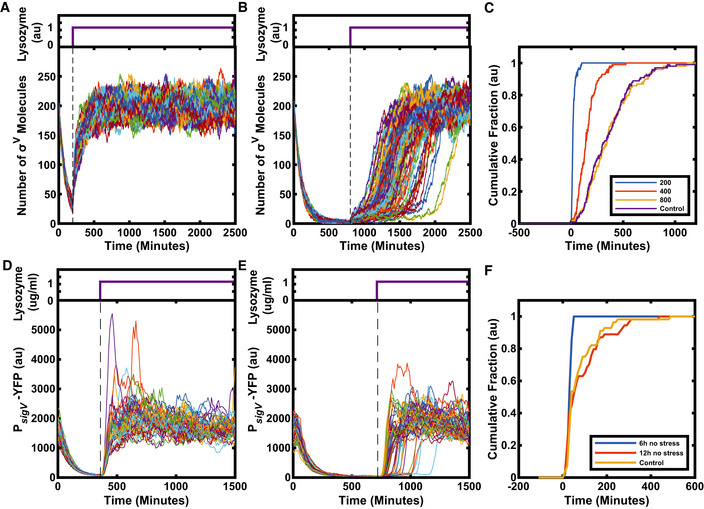
Figure 6. The σV circuit has a memory of previous stress.

-
ASimulations predict that after a break in stress, on reapplication of stress all cells turn on σV immediately and homogeneously (N = 99).
-
B, CWith increasing intervals between stresses, response heterogeneity reappears in the model, indicating a loss of memory. (C) Each line represents the cumulative fraction of cells (N = 99) with σV concentration values that are higher than the half maximum of their final values (representing cells that have activated). If the interval between stress is increased long enough, (800 au), the heterogeneity is the same as if the cells had not experienced a prior lysozyme stress (control).
-
DExperiments confirm memory in the σV circuit. For short intervals between stress applications, cells respond immediately and homogeneously. Each line corresponds to one of 48 single‐cell traces.
-
E, FFor very long intervals between stress (12 h), the heterogeneity is the same as if the cells had not experienced a prior lysozyme stress (control). N > 50 single‐cell traces.
Data information: For more information on the number of repeats, please see Appendix Table S3.
