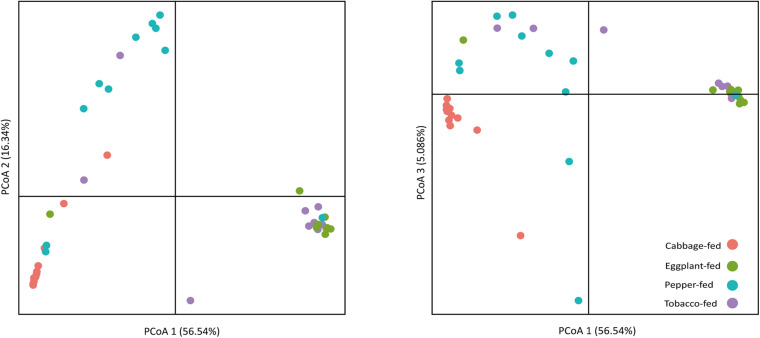
FIGURE 2.
Principal coordinates analysis (PCoA) of bacterial community structure in cabbage-fed and Solanaceae-fed aphids. Three dimensions that explain highest degree of variance were included in visualization. Percentage variance explained is indicated on respective axes. Different colors of dots indicate different sample types. Significance of differences between different bacterial communities was tested with ANOSIM in QIIME 2.

