Figure 2.
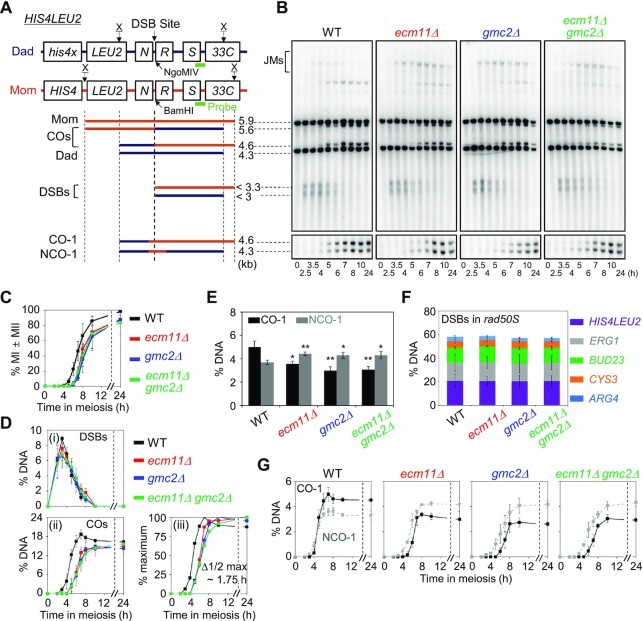
Physical analysis of meiotic recombination in ecm11Δand gmc2Δ mutants. (A) Physical map of the HIS4LEU2 locus of chromosome III showing the XhoI (X) restriction endonuclease site and the position of the probes used for Southern hybridization. Maternal and paternal fragments were distinguished based on XhoI polymorphisms. For the analysis of CO-1 and NCO-1, DNA was digested with the XhoI and NgoMIV endonucleases. Mom, maternal species (5.9 kb); Dad, paternal species (4.3 kb); COs, crossovers (5.6 kb and 4.6 kb); DSBs, double-strand breaks (<3.3 and <3 kb); CO-1, crossover (4.6 kb); NCO-1, non-crossover (4.3 kb). (B) One-dimensional (1D) gel analysis of DSBs, COs and NCOs in WT, ecm11Δ, gmc2Δ, and ecm11Δ gmc2Δ strains. Gel analysis (1D) showing Mom, Dad, DSBs and CO species (top). CO-1 and NCO-1 of recombinants are displayed in the CO/NCO gel analysis (bottom). (C) Meiotic nuclear division for WT, ecm11Δ, gmc2Δ, and ecm11Δ gmc2Δ strains. Error bars indicate SDs based on three independent time-course experiments. (D) Quantitative analysis of DSBs and COs. (i) Quantification of DSBs. (ii) Quantification of COs. (iii) Normalized CO levels from the analysis shown in (ii). Δ1/2 max, the difference between the times of 50% of the maximum CO levels for WT and mutants. Data are the mean ± SD (N = 3). (E) Quantitative analysis of COs and NCOs in three independent meiotic time-course experiments (data are the mean ± SD). Significance was examined using an unpaired Student's t-test (**P < 0.01; *P < 0.05). (F) Quantitative analysis of DSBs at various loci in rad50S, rad50S ecm11Δ, rad50S gmc2Δ and rad50S ecm11Δ gmc2Δ strains. Data are mean ± SD (N = 3 for ARG4, BUD23, CYS3, and ERG1; N = 4 for HIS4LEU2). See also Supplementary Figure S3. (G) Quantitative analysis of CO-1 (black line) and NCO-1 (gray dashed line). Data are the mean ± SD (N = 3).

