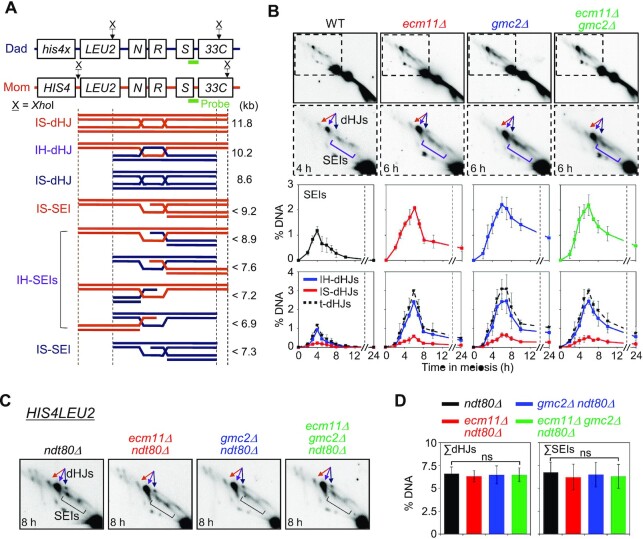
Figure 3.
Two-dimensional (2D) gel analysis of ecm11Δ, gmc2Δ and ecm11Δ gmc2Δ in WT and ndt80Δ backgrounds. (A) Physical map of the HIS4LEU2 locus. IH-dHJ, interhomolog double-Holliday junction; IS-dHJ, intersister double-Holliday junction; SEI, single-end invasion. (B) Representative images of 2D analysis of WT, ecm11Δ, gmc2Δ, and ecm11Δ gmc2Δ strains (top). Quantitative analysis of SEIs and dHJs (bottom). Data are the mean ± SD (N = 3). Full images in Supplementary Figure S5. t-dHJs, total dHJs. (C) Representative 2D analysis images of the HIS4LEU2 locus in the ndt80Δ, ecm11Δ ndt80Δ, gmc2Δ ndt80Δ and ecm11Δ gmc2Δ ndt80Δ strains. (D) Quantitative analysis of dHJs and SEIs in an ndt80Δ background at the HIS4LEU2 locus. Gel images at t = 8 h were used to quantify DNA signals. Data are the mean ± SD (N = 3). Significance was examined using an unpaired Student's t-test (ns, not significant).

