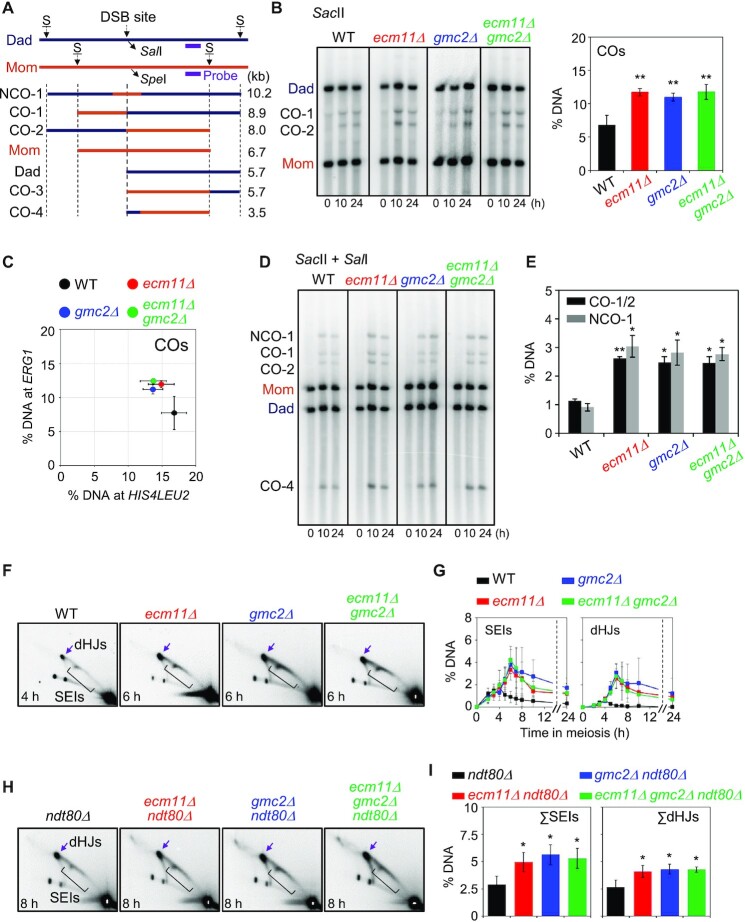
Figure 4.
Meiotic recombination analysis at the ERG1 locus in ecm11Δ, gmc2Δ and ecm11Δ gmc2Δ mutants. (A) Schematic diagram of the ERG1 locus showing restriction enzyme sites and the probe position (15). Parental chromosomes, Mom and Dad, were distinguished by restriction enzyme site polymorphisms (S = SacII). (B) Representative image of 1D gel analysis at the ERG1 locus in WT, ecm11Δ, gmc2Δ and ecm11Δ gmc2Δ strains. Quantitative 1D gel analysis of ERG1 locus in the WT, ecm11Δ, gmc2Δ, and ecm11Δ gmc2Δ strains. Maximum CO levels are shown. Data are the mean ± SD (N = 3). Significance was examined using an unpaired Student's t-test (**P < 0.01). (C) Comparison of CO levels at the HIS4LEU2 and ERG1 loci. Each colored circle indicates the HIS4LEU2 versus ERG1 CO. The data indicate the means ± SD (N = 3). (D) Representative image of CO and NCO analysis of WT, ecm11Δ, gmc2Δ, and ecm11Δ gmc2Δ strains. For CO and NCO gel analysis, the DNA samples were digested with SacII and SalI. (E) Quantitative analysis of CO and NCO. Data indicate the mean ± SD (N = 3). Significance was examined using unpaired Student's t-test (*P < 0.05, **P < 0.01). (F) Representative 2D gel analysis image of the ERG1 locus. (G) Quantitative analysis of SEIs and dHJs. The data indicate the mean ± SD (N = 3). (H) 2D gel analysis of the ERG1 locus in ndt80Δ, ndt80Δ ecm11Δ, ndt80Δ gmc2Δ and ndt80Δ ecm11Δ gmc2Δ strains. DNA samples were digested with HindIII and used for 2D analysis to detect JMs at the ERG1 locus via Southern blotting using an ERG1 probe (15). See also Supplementary Figure S6. (I) Quantification of SEIs and dHJs at the ERG1 locus. Gel images at t = 8 h were used to quantify DNA signals. Data are the mean ± SD (N = 3). Significance was examined using an unpaired Student's t-test (*P < 0.05).

