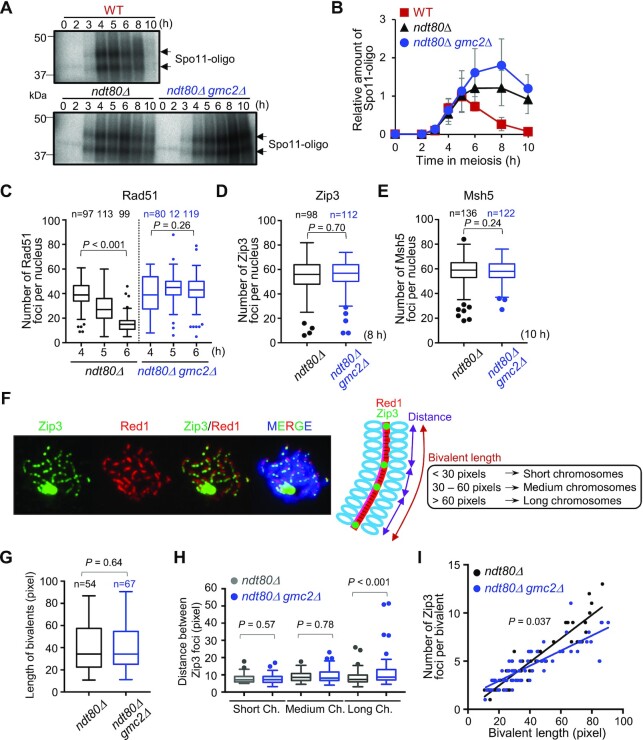
Figure 5.
DSB formation and Zip3 distribution in WT and gmc2Δ cells. (A) Representative image of 32P-labeled DNA fragments covalently bound to Spo11-3FLAG in immunoprecipitates from WT, ndt80Δ, and ndt80Δ gmc2Δcells at the indicated time points. (B) Relative DNA fragment signals at each time point. Relative amounts of Spo11-oligo complex were determined as described in the Materials and Methods section. Data are the mean ± SD (N = 3). (C) Average number of Rad51 foci per nucleus at the indicated time points in the ndt80Δ and ndt80Δ gmc2Δmutants. The number of nuclei at each time point is shown at the top. (D) Average number of Zip3 foci per nucleus in the ndt80Δ and ndt80Δ gmc2Δ mutants. The number of nuclei at each time point is shown at the top. (E) Average number of Msh5 foci per nucleus in the ndt80Δ and ndt80Δ gmc2Δ mutants. The number of nuclei counted at each time point is shown at the top. (F) Representative image of a meiotic nuclear spread from ndt80Δ cells at 8 h post-meiosis entry. The cells were co-stained for anti-Red1 (red) and anti-Zip3 (green). A schematic explanation of the classification into bivalent length categories is shown. (G) Comparison of the distribution of bivalent length between ndt80Δ and ndt80Δ gmc2Δmutants. (H) Distribution of distances between adjacent Zip3 foci on short, medium, and long bivalents. Data are the mean ± SD (N ≥ 3). The data were analyzed using the Mann−Whitney U-test, and the results are shown in panels G and H. Boxplots in C, D, E, G and H show medians and interquartile ranges (IQRs), and the whiskers indicate the values that are 1.5 times the IQR, based on the Tukey method. (I) Correlations between the total numbers of Zip3 foci on each bivalent and bivalent length in WT and gmc2Δ strains. P-values were determined using the Wald−Wolfowitz runs test.

