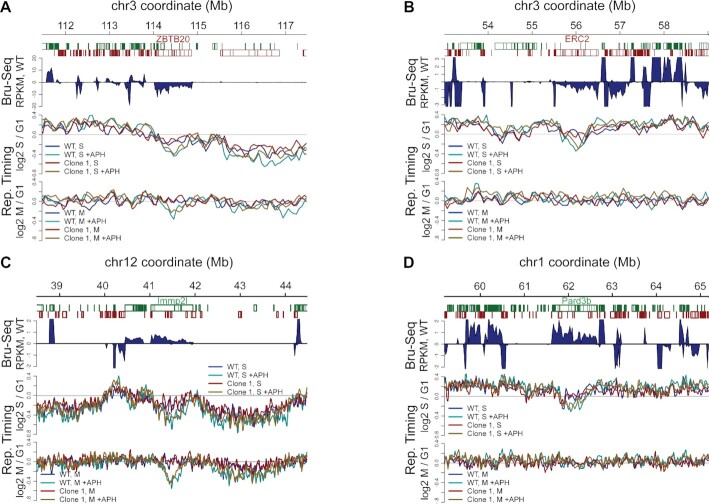
Figure 6.
Large gene transcription is not sufficient to confer failed recovery of an APH-induced replication delay. Composite plots at four large genes show Bru-seq signal corresponding to nascent transcription (top panels) as well as relative replication timing in S and G2/M fractions (middle and bottom panels, respectively). (A) Plot illustrating delayed replication recovery from APH at transcribed gene ZBTB20, similar to NLGN1 and FHIT (Figure 5F,G). (B) In contrast, gene ERC2 showed a delay in S that was resolved by M, despite its active transcription. (C and D) are similar to (A) and (B) in showing mouse genes that do (Immp2l, C) and do not (Pard3b, D) manifest a prolonged APH-induced replication delay in M phase even though both are transcribed and show an APH delay in S. Trace colors in all panels are: blue, WT; cyan, WT + APH; red, Clone 1; gold, Clone 1 + APH.

