Figure 2.
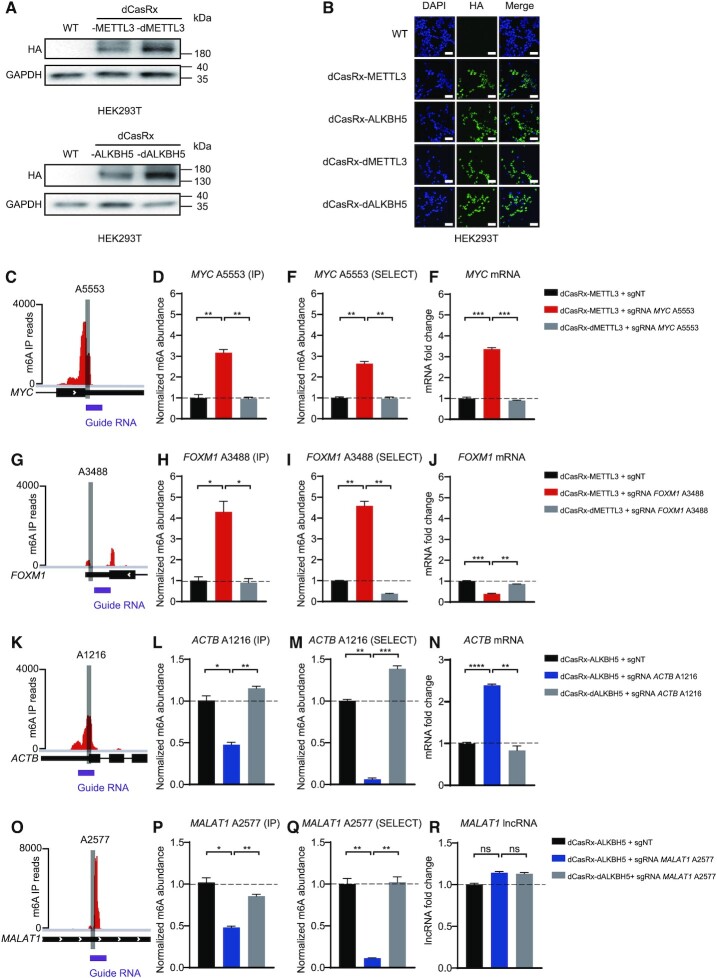
Cellular localization of dCasRx epitranscriptomic editors and targeted manipulation of endogenous transcript methylation in HEK293T cell. (A) Western blot results of HA-tag demonstrated expression of dCasRx epitranscriptomic editors in living HEK293T cells when treated with dCasRx-METTL3, dCasRx-ALKBH5, dCasRx-dMETTL3 and dCasRx-dALKBH5. (B) Representative immunofluorescence images of HEK293T cells transfected with HA-tagged dCasRx epitranscriptomic editors. Scale bars, 40 μm. (C) Schematic diagram of m6A distribution in MYC mRNA. (D) Normalized abundance of m6A at MYC A5553 detected by me-RIP. (E) Normalized abundance of m6A at MYC A5553 detected by SELECT. (F) Abundance of MYC mRNA increased after dCasRx-METTL3 editing in HEK293T cell. (G) Schematic diagram of m6A distribution in FOXM1 mRNA. (H) Normalized abundance of altered m6A at FOXM1 A3488 detected by me-RIP. (I) Normalized abundance of altered m6A at FOXM1 A3488 detected by SELECT. (J) Abundance of FOXM1 mRNA decreased after dCasRx-METTL3 editing in HEK293T cell. (K) Schematic diagram of m6A distribution in ACTB mRNA. (L) Normalized abundance of m6A at ACTB A1216 detected by me-RIP. (M) Normalized abundance of m6A at ACTB A1216 detected by SELECT. (N) Abundance of ACTB mRNA increased after dCasRx-ALKBH5 editing in HEK293T cell. (O) Schematic diagram of m6A distribution in MALAT1 RNA. (P) Normalized abundance of altered m6A at MALAT1 A2577 detected by me-RIP. (Q) Normalized abundance of altered m6A at MALAT1 A2577 detected by SELECT. (R) Abundance of MALAT1 lncRNA has not changed after dCasRx-ALKBH5 editing in HEK293T cell. Distributions of m6A was based on a database GSE63753 (49). Data were displayed as mean ± SEM (ANOVA; ns: not significant, *:P < 0.05, **:P < 0.01, ***:P < 0.001, ****:P < 0.0001; n = 3).

