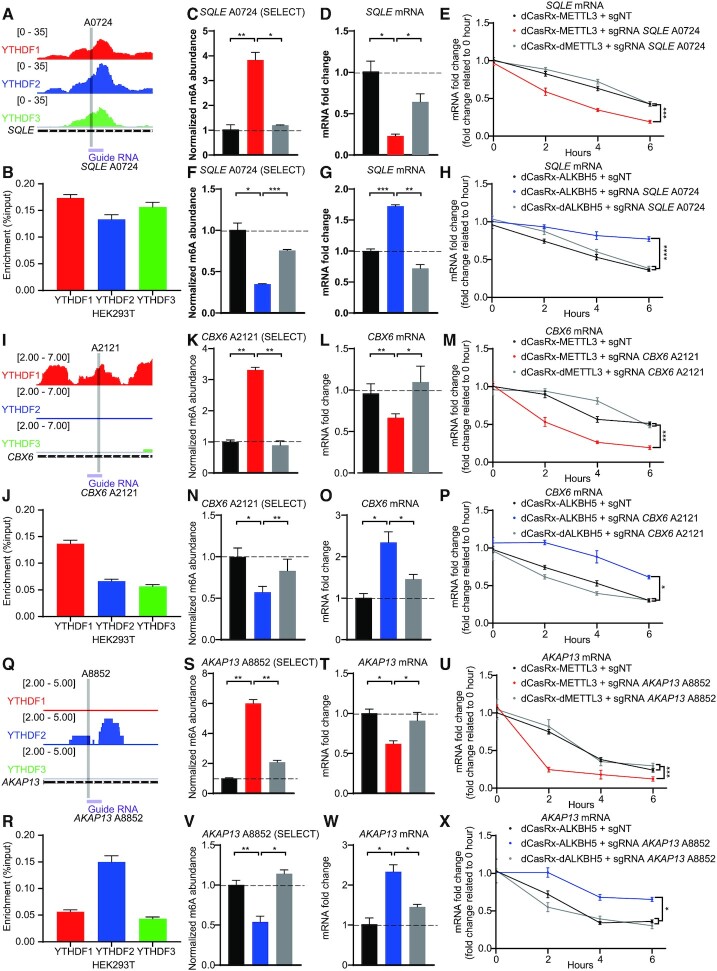
Figure 5.
m6A sites binding with DF paralogs control the degradation of endogenous transcripts in HEK293T cells. (A, I andQ) Schematic diagrams of distribution of DF paralogs in endogenous SQLE mRNA (A), CBX6 mRNA (I), AKAP13 mRNA (Q). Distributions of DF paralogs was based on a database GSE78030 (11). (B, J andR) The combination of YTHDF paralogs at SQLE A0724 (B), CBX6 A2121 (J), AKAP13 A8852 (R) in HEK293T cells, quantified by YTHDF paralog RIP coupled with RT-qPCR. Data are displayed as mean ± SEM (n = 3). (C, K andS) Normalized abundance of altered m6A at SQLE A0724 (C), CBX6 A2121 (K), AKAP13 A8852 (S) edited by dCasRx-METTL3. (D, L andT) Abundance of SQLE mRNA (D), CBX6 mRNA (L), AKAP13 mRNA (T) decreased after dCasRx-METTL3 editing. (E, M andU) mRNA degradation measurement of SQLE (E), CBX6 (M), AKAP13 (U) in HEK293T cells edited with dCasRx-METTL3. (F, N andV) Normalized abundance of altered m6A at SQLE A0724 (F), CBX6 A2121 (N), AKAP13 A8852 (V) edited by dCasRx-ALKBH5. (G, O andW) Abundance of SQLE mRNA (G), CBX6 mRNA (O), AKAP13 mRNA (W) increased after dCasRx-ALKBH5 editing. (H, P andX) mRNA degradation measurement of SQLE (H), CBX6 (P), AKAP13 (X) in HEK293T cells transfected with dCasRx-ALKBH5. Data are represented as mean ± SEM. (ANOVA; *, P < 0.05; **, P < 0.01; ***, P < 0.001; ****, P < 0.0001; n = 3).

