Figure 2.
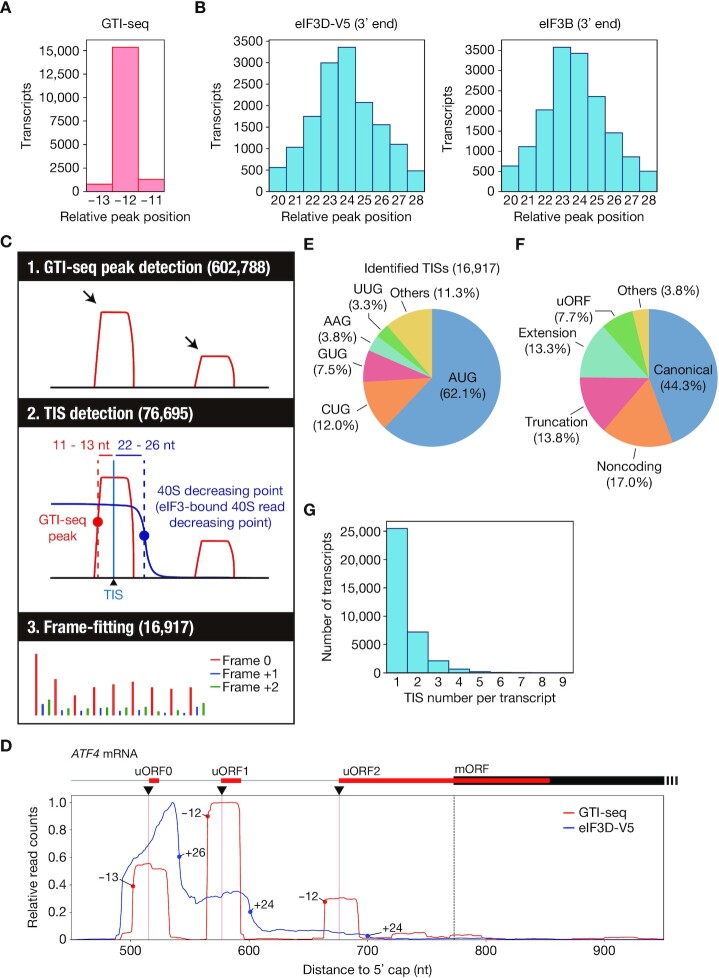
Identification of ORFs and TISs in HEK293T cells by TISCA. (A) Histogram for the 5′ end position of GTI-seq footprints relative to the start codon for all human protein-coding transcripts. (B) Histograms for the 3′ end position of eIF3D-V5 or eIF3B footprints relative to the start codon for all human protein-coding transcripts as determined by Sel-TCP-seq. (C) Schematic overview of TISCA. TISs were identified from the combination of GTI-seq and 40S dynamics, followed by frame-fitting on the basis of Ribo-seq results. (D) Read aggregation plots for GTI-seq and Sel-TCP-seq analysis of eIF3D-V5 on ATF4 mRNA. Red and blue circles show GTI-seq peaks and 40S decreasing points, respectively; red and dashed black vertical lines indicate TIS positions of uORFs and of the main ORF (mORF), respectively; and black inverted triangles denote the TIS positions identified by TISCA. (E, F) Pie charts indicating the composition of initiation codons (E) and the types of translated ORFs (F) identified by TISCA. (G) Number of TISs for each transcript identified by TISCA.

