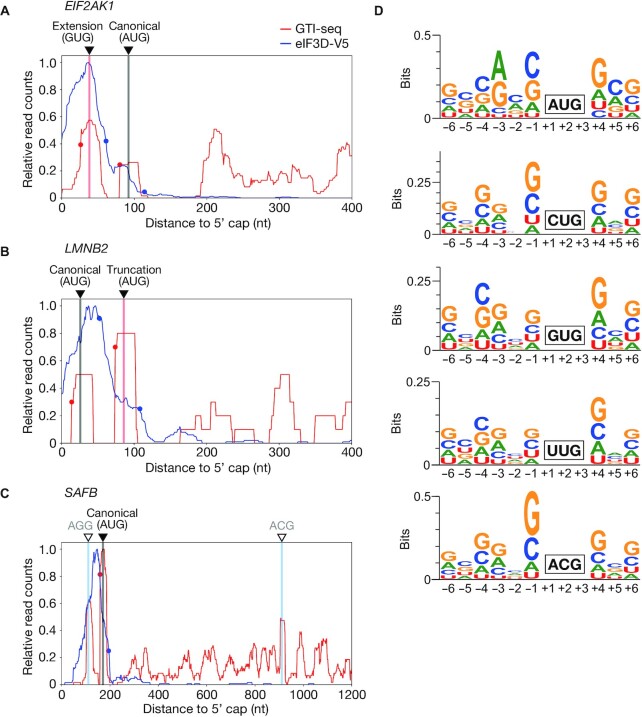
Figure 3.
Detailed analysis of initiation codons identified by TISCA. (A–C) Read aggregation plots for GTI-seq as well as for Sel-TCP-seq of eIF3D-V5 for EIF2AK1 (A), LMNB2 (B), and SAFB (C) mRNAs. Red and blue circles show GTI-seq peaks and 40S decreasing points, respectively; black inverted triangles indicate TIS positions identified by TISCA; red and black vertical lines denote novel TIS positions identified by TISCA and canonical TIS positions, respectively; and white inverted triangles with blue vertical lines indicate TIS positions identified only by GTI-seq. (D) Motif analysis for surrounding sequences of AUG, CUG, GUG, UUG and ACG initiation codons identified by TISCA.

