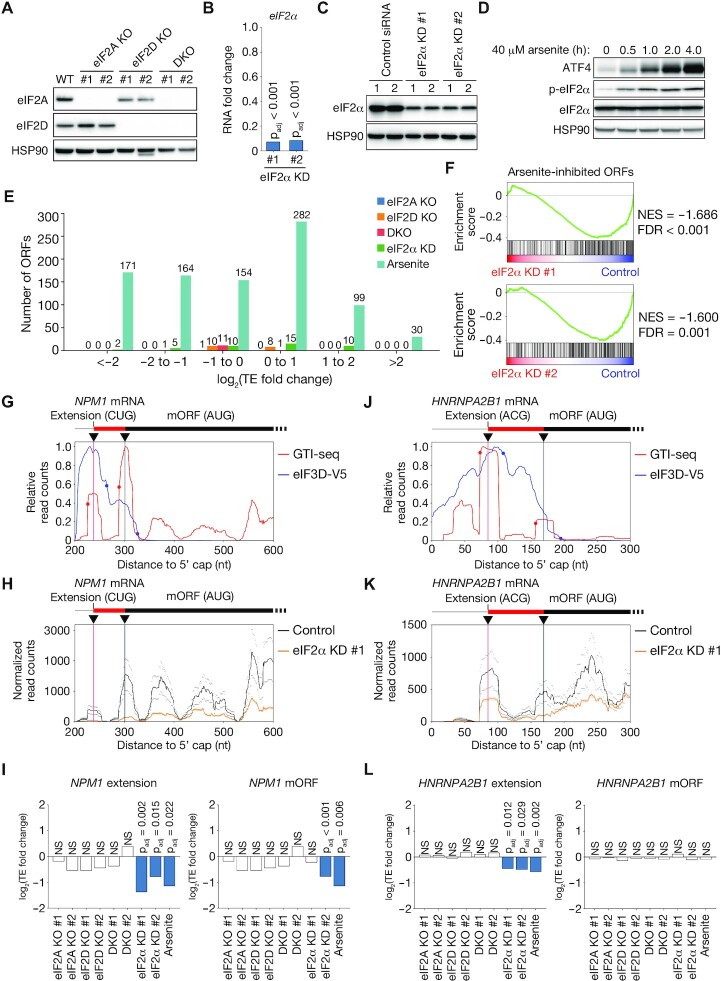
Figure 6.
eIF2 dependency of translation initiation at near-cognate codons. (A) Immunoblot analysis of eIF2A and eIF2D in HEK293T cells deficient in eIF2A (eIF2A KO), eIF2D (eIF2D KO), or both eIF2A and eIF2D (DKO) as well as in WT cells. Two independent clones of each type were examined, and HSP90 was analyzed as a loading control. (B) Fold change in RNA abundance for eIF2α mRNA in HEK293T cells transfected with siRNAs specific for eIF2α (eIF2α KD #1 or #2) relative to HEK293T cells transfected with a control siRNA. padj, adjusted P value. (C) Immunoblot analysis of eIF2α in HEK293T cells transfected with siRNAs as in (B). Lanes 1 and 2 correspond to biological replicates. (D) Immunoblot analysis of ATF4 as well as of phosphorylated (p-) and total forms of eIF2α in WT HEK293T cells treated with 40 μM arsenite for the indicated times. (E) Numbers of ORFs showing a significant change (adjusted P value of <0.05) in translation efficiency (TE) in eIF2A KO, eIF2D KO, and DKO cells, in eIF2α KD cells, as well as in arsenite-treated WT HEK293T cells compared with control cells. For eIF2A KO, eIF2D KO, DKO and eIF2α KD cells, ORFs not commonly up-regulated or down-regulated in two clones or with two different siRNAs were removed. (F) GSEA plots for ORFs initiated at near-cognate codons whose translation efficiency was down-regulated by arsenite treatment. Translation of these ORFs is compared between eIF2α KD cells and control HEK293T cells. NES, normalized enrichment score. (G, J) Read aggregation plots for GTI-seq and Sel-TCP-seq of eIF3D-V5 for NPM1 (G) and HNRNPA2B1 (J) mRNAs. Red and blue circles show GTI-seq peaks and 40S decreasing points, respectively; black inverted triangles indicate TISs identified by TISCA; and red and black vertical lines denote novel TISs identified by TISCA and canonical TISs, respectively. (H, K) Read aggregation plots of Ribo-seq for NPM1 (H) and HNRNPA2B1 (K) mRNAs in HEK293T cells transfected with control or eIF2α siRNAs. The average of two replicates is shown. (I, L) Fold change in translation efficiency for mORF and the extended ORF of NPM1 (I) and HNRNPA2B1 (L) as analyzed by RiboDiff in eIF2A KO, eIF2D KO, DKO and eIF2α KD cells as well as in arsenite-treated WT cells compared with control cells.

