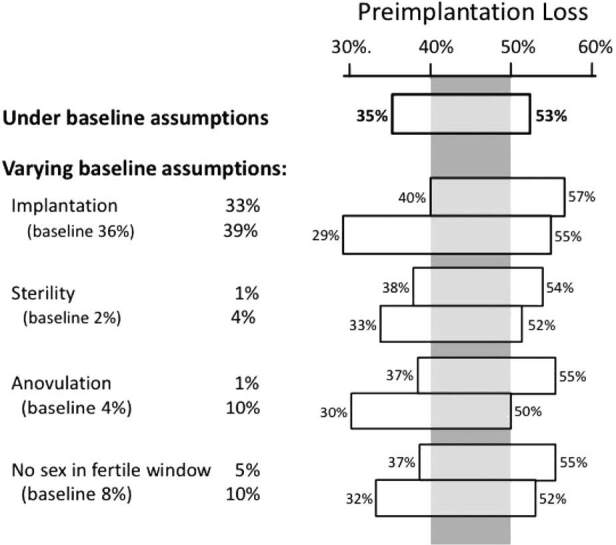
Figure 4. Estimated range of preimplantation loss under a series of varying assumptions about underlying biological processes. Numbers in parentheses are the baseline assumptions used in the main analysis, holding constant the assumption of ovum fertilization within the range of 64–90%. Even within these variations, there is a range of preimplantation loss (40 to 50%, shown by the gray vertical panel) that remains under all assumptions.

