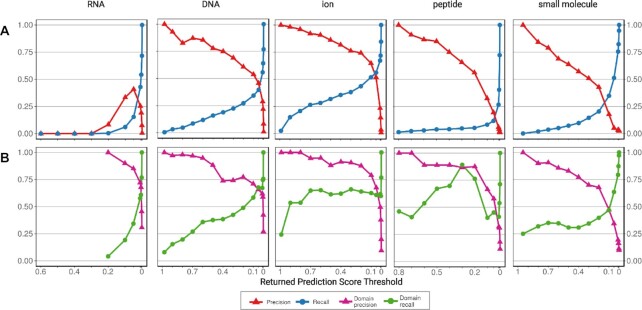
Figure 3.
Precision and recall as a function of prediction scores. For the best performing model for each ligand, we plot the precision and recall when considering all predictions greater than a specific score threshold (x-axis). Predictions are made in cross-validation, and predictions across all folds are considered together. (A) Precision (red) and recall (blue) averaged across the five folds. (B) Precision (pink) and recall (green) values computed for each of the domains that bind the ligand and then averaged across all such domains. All precision and recall are plotted up to the highest prediction score threshold returned for each ligand.

